You need to test, we're here to help.

You need to test, we're here to help.

28 November 2022

New 60 V Offset Power Rail Probes Offer the Capability Needed for 48 V Power Integrity Analysis

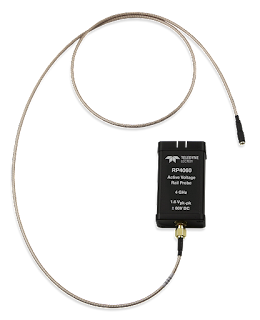
RP4060 Rail Probe
Figure 1. The RP2060 and RP4060
build on the legacy of the RP4030 power
rail probe. The new probes are ideally
suited to working with the new 48 Vdc 
power structures.
In 2016, Teledyne LeCroy first offered the RP4030 Power Rail Probe, which was designed to enable engineers to probe a low-impedance, low-voltage DC power/voltage rail signal without loading the device under test (DUT). It provided ±30 V of probe offset to allow a DC power/voltage rail signal to be displayed in the vertical center of the oscilloscope regardless of the gain (sensitivity) setting.

Recently, we released two, new power rail probes that build on those capabilities—the 2 GHz RP2060 and 4 GHz RP4060. Both probes feature:

  • ±60 V Offset Capability
  • ±800 mV Dynamic Range
  • 50 kΩ DC Input Impedance (for low loading of low-impedance power rails)
  • 1.2:1Attenuation (for low additive noise)
  • MCX-terminated cable with a variety of board connections: 4 GHz*-rated MCX PCB mount;
    4 GHz* solder-in; 3 GHz* coaxial cable to U.FL PCB mount; optional 500 MHz browser
* Bandwidths listed are for the 4 GHz RP4060. Maximum bandwidth when used with RP2060 is 2 GHz.

Why the New Probes?

One driver of the new release is the increase in the number and size of data centers needed to support cloud computing and other data-intensive applications, and the new power architectures they require. The new rail probe is designed to ideally meet the needs of engineers working with power rails rated up to 48 Vdc.

21 November 2022

Oscilloscope Serial Data Measurements and DAC: Trigger, Decode, Measure/Graph and Eye Diagram Software

Table of serial bus measurement parameters
Figure 1. Serial bus measurements made available
with "TDME" and "TDMP "decoder options.
All Teledyne LeCroy oscilloscopes support a rich set of standard waveform measurement parameters, but the installation of any "TDME" or "TDMP" serial decoder software option adds special parameters designed for measuring serial data buses. Besides automating the measurement of serial bus timing, these parameters allow you to access encoded serial data and extract it to analog values for what is essentially a Digital-to-Analog Converter (DAC)!

What’s in a Name?

Teledyne LeCroy has adopted the convention of using a key in the name of our serial trigger and decode products that tells you what capabilities they offer.  The “ME” or “MP” in the name of a Teledyne LeCroy serial decoder option (e.g., CAN FDbus TDME or USB4-SB TDMP) refers to "Measure/Graph and Eye Diagram" or "Measure/Graph and Physical Layer Tests." All these options include the following 10 serial bus measurements. Physical Layer Test options will also include measurements designed specifically to meet the requirements of the standard.

14 November 2022

SDAIII and QualiPHY Software: Oscilloscope Eye Diagrams for Compliance and Debug

Figure 1. SDAIII enables eye diagrams and eye measurements of four lanes of  streaming data.
Figure 1. SDAIII enables eye diagrams and eye
measurements of four lanes of  streaming data.
Besides the serial TDME and TDMP options discussed earlier, there are other ways to generate eye diagrams on your Teledyne LeCroy oscilloscope for compliance testing and debug.

SDAIII Serial Data Analysis Software

SDAIII offers the most comprehensive eye diagram capabilities for Teledyne LeCroy oscilloscopes, with tools for optimizing the displayed eye that are especially useful to high-speed serial data analysis.

11 November 2022

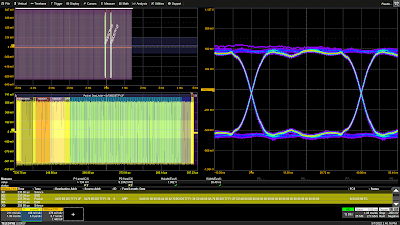
Serial Trigger, Decode, Measure/Graph & Eye Diagram (TDME) Software: Oscilloscope Eye Diagrams for Debug

Eye diagrams generated from two serial decodes.
Figure 1. Two eye diagrams generated from 
three active USB serial decoders.
Click any image to enlarge it.

The eye diagram is a general-purpose tool for analyzing the signal integrity of serial digital communications signals. It shows the effects of additive vertical noise, horizontal jitter, duty cycle distortion, inter-symbol interference, and crosstalk on a serial data stream. The vertical opening of the eye is affected by these elements, as well as gain differences between devices on the bus, so that the more problems with signal integrity, the more “sleepy” the eye appears. A wide open eye is indicative of good signal integrity.

It is commonplace to use an oscilloscope with decoder software to analyze the health of serial data streams, where the combination of the electrical waveform and the link layer decoding shows if and where the protocol breaks down at the physical layer, but an eye diagram can better show the degree of signal interference that may be impacting the serial logic—especially if it could be generated for particular devices or packets.

10 October 2022

Oscilloscope Testing of 10Base-T1S Automotive Ethernet Signal Integrity

Eye diagram generated from decoded 10Base-T1S signal
Figure 1. The 10Base-T1S TDME option features
easy eye diagram creation for signal integrity analysis.
Click on any image to enlarge it.
In addition to special serial data bus measurements of 10Base-T1S signals, the 10Base-T1S Trigger, Decode, Measure/Graph & Eye Diagram (TDME) option automates the generation and display of eye diagrams on Teledyne LeCroy oscilloscopes. Eye diagrams are an important element of serial data analysis, used to understand the signal integrity of the communications network. 

The eye diagram is a general-purpose tool for analyzing serial digital communications signals. It shows the effects of additive vertical noise, horizontal jitter, duty cycle distortion, inter-symbol interference, and crosstalk on a serial data stream. 

The eye diagram is formed by overlaying repetitive occurrences of slightly more than a single clock period (UI) of a serial data signal on a persistence display which shows the accumulated history of multiple acquisitions, as shown in Figure 1.

Due to the use of Differential Manchester encoding (DME), the 10Base-T1S eye is formed with twice the signal clock rate. The signal shown has a symbol rate of 12.5 Mbps and the eye is clocked at 25 Mbps. 

05 October 2022

Oscilloscope Measurements of 10Base-T1S Automotive Ethernet PLCA Cycle Timing

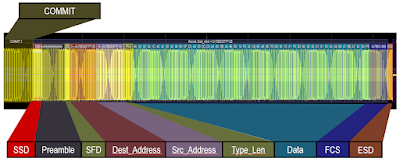
10Base-T1S frame with color-coded decoder overlay
Figure 1. Color-coded decoding of 10Base-T1S
stream makes it easy to measure timing between
signal elements. Click on any image to enlarge.
The 10Base-T1S Trigger-Decode (TD) and 10Base-T1S Trigger, Decode, Measure/Graph & Eye Diagram (TDME) options enable Teledyne LeCroy oscilloscope users to trigger on and decode Ethernet control and payload data from 10Base-T1S Automotive Ethernet signals. The decoding is color-coded to provide fast, intuitive understanding of the relationship between message frames and other time-synchronous events. Knowing the location of the various protocol elements makes it easy to measure Physical Layer Collision Avoidance (PLCA) cycle timing using either standard oscilloscope tools, or special serial bus measurements included with the TDME options.

PLCA cycle timing is measured to assure interoperability of the attached nodes in a 10Base-T1S mixed-segment, multidrop bus. This class of tests measures the timing between events on the bus relative to a specific bus event, usually the BEACON signal initiated by the Master node. 

Let’s look at a simple example of a 10Base-T1S network with two nodes, the Master (Node 0) and a device (Node 3). The acquired waveform is shown in Figure 2, decoded using the 10Base-T1S TDME option. The top grid shows the complete acquisition, which consists mostly of BEACON signals over a record of twenty-five million samples. Toward the end of the acquisition are two packets from the other nodes. The table at the bottom of the screen lists all the elements decoded in the full acquisition.

12 September 2022

Isolated Oscilloscope Inputs vs. Isolated Oscilloscope Probes

Some users in high-voltage test environments seek measuring instruments with isolated inputs because they want the safety and convenience of isolation without having to spend money on an isolated oscilloscope probe, like the Teledyne LeCroy DL-ISO or the Tektronix IsoVu®. While that's understandable, isolated inputs built into the instrument channel may be convenient, but they don't necessarily give you good performance, certainly not as good as  you would get from a high quality, high-voltage isolated probe.

Figure 1. Cascaded H-bridge signals captured using an isolated input (left) and an isolated probe (right).

05 September 2022

Choosing a High-voltage Oscilloscope Probe for SiC/GaN Power Semiconductor Device Measurements

Wide-bandgap (GaN) power semiconductor device waveforms captured using two, different probe topologies
Figure 1: Wide-bandgap (GaN) power semiconductor device
waveforms captured using two, different probe topologies.
Click on any image to expand.
In our last post, we introduced you to a new tool on the Teledyne LeCroy website: The High-voltage Probe Selection Guide. To demonstrate the benefits of the guide, let’s explore further what must be considered when choosing an HV oscilloscope probe for power semiconductor device measurements.

Why are power semiconductor device measurements challenging?

29 August 2022

How to Choose the Best High-voltage Oscilloscope Probe in 5 Minutes

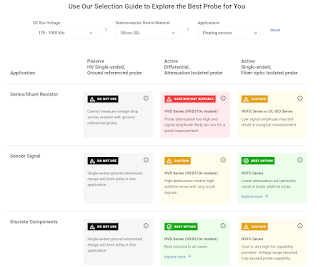
High-voltage Probe Selection Guide color codes better or worse probe selections.
Figure 1: The High-voltage Probe Selection Guide
color codes better or worse probe selections based on
your answers to three, simple questions.
Click any image to enlarge.
Probing high-voltage (HV) circuits for analysis with an oscilloscope presents unique challenges due to the potential for injury or equipment damage, as well as the demands of the materials used in HV semiconductors. HV floating measurements are extremely dangerous and difficult to make. Conventional passive probes are not the answer, but isolated and high-voltage differential probes are options. Yet, with many possible choices in these categories, how can you decide which is actually the best HV oscilloscope probe for your application?

Teledyne LeCroy offers this new, easy way to help you select a high-voltage oscilloscope probe based on your specific application—the High-voltage Probe Selection Guide—available on the Teledyne LeCroy website at: teledynelecroy.com/powerprobes

22 August 2022

Physical-Layer Collision Avoidance in 10Base-T1S Automotive Ethernet

Fig.1, 10Base-T1S PLCA cycle. If there is no data traffic (top), only BEACONs are seen on the bus.  Data from a node (bottom) will expand the time between two BEACONs.
Fig.1, 10Base-T1S PLCA cycle. If there is no data
traffic (top), only BEACONs are seen on the bus. 
Data from a node (bottom) will expand the time
between two BEACONs.
10Base-T1S (IEEE 802.cg) is a variant of Automotive Ethernet  that supports half-duplex and full-duplex communication, allowing either a point-to-point direct connection between two nodes, or use of a multidrop topology with up-to-eight nodes connected on a single 25 m bus segment.

Multidrop cabling of one bus line provides options to extend and scale with fewer physical wires and less weight than point-to-point topologies. With minimum connector space at the ECU, the bus line can be expanded simply by adding sensor units. A bus line with additional sensor units for ultrasonic and short-range radar is an example of how multidrop cabling can be scaled.  

Among the main objectives of the 10Base-T1S PHY layer are reconciliation of transmissions from a variety of mediums, ensuring cooperative behavior by the nodes on a multidrop bus. One way it does this is through the use of Physical-Layer Collision Avoidance (PLCA) technology to minimize dead time and avoid collisions. In this post, we'll describe the workings of PLCA and in a future post, how you can debug PLCA timing issues using an oscilloscope with the 10Base-T1S TDME software.

15 August 2022

10Base-T1S Automotive Ethernet vs. 10Base-T1L Industrial Ethernet

Figure 1: 10Base-T1S and 10Base-T1L differ primarily in reach, encoding methods, topology and applications.
Figure 1: 10Base-T1S and 10Base-T1L differ primarily in
reach, encoding methods, topology and applications.
10Base-T1S, a variant of Automotive Ethernet, and 10Base-T1L, also known as Industrial Ethernet, are Single Pair Ethernet (SPE) protocols described in IEEE 802.cg standards. Both offer the same 10 Mb/s communication speed using a single, unshielded twisted pair (T1), but differ in specifics of reach, encoding schemes and topologies, as well as their principal applications.

08 August 2022

Using TF-USB-C-HS for USB 3.2 PHY-Logic Layer Debug

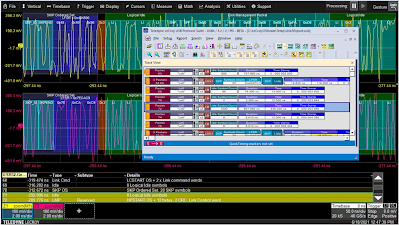
Figure 1. USB 3.2 electrical decoding with ProtoSync view of protocol packets, captured using TF-USB-C-HS. Click on any image to enlarge it.
Figure 1. USB 3.2 electrical decoding with ProtoSync
view of protocol packets, captured using TF-USB-C-HS.
Click on any image to enlarge it.
In a USB-C connector, link training for USB 3.1/3.2 is negotiated using an LTSSM (Link Training and Status State Machine) through electrical signaling on the TX1/RX1 and TX2/RX2 connector pins. Link training must be completed on the link before high-speed data transactions can occur.  One problem you might encounter during link training is a failure to train to USB 3.2 Gen 2 specifications. Teledyne LeCroy customers report that most system-interoperability problems are caused by either link-training or sideband-negotiation failures, which in turn can result from an electrical problem, a digital problem or a combination of both. 

TF-USB-C-HS enables you to probe all points on the USB-C connector to measure and analyze live links. The insertion-loss profile of the included cable and coupon is tuned to be the equivalent of a golden 0.8-m USB Type-C cable, so you can replace a 0.8-m cable with the coupon and not experience any difference in link performance. The coupon also has a loop to allow a current probe to make load-current measurements, and the HS version is compatible with Teledyne LeCroy DH Series probes for making high-speed differential measurements.

We'll show how to trigger, acquire and decode to find problematic link training packets synchronous with the physical-layer electrical waveforms, so you can tell if the source of your interoperability  problem is electrical, logical or both.

01 August 2022

Signal and Power Integrity Tutorial: Power Rail Probing for Rail Compression

Figure 3. Equivalent circuit of a typical CMOS I/O showing the connection from the on-die rails and the board-level test points.
Figure 3. Equivalent circuit of a typical CMOS I/O
showing the connection from the on-die rails
and the board-level test points.
By Prof. Eric Bogatin,
Teledyne LeCroy Fellow

Excerpted by permission from the Signal Integrity Journal article, Measuring Only Board-level Power Rail Noise May Be Misleading

Continued from Part 1.


Measuring Rail Compression on the Die

In most applications, we do not have access to the bare die when the chip is assembled on the circuit board. If the IC package has not been instrumented with special pass-through features connecting the rails on the die to board pins, we have to rely on a special trick. [The use of a quiet HIGH and quiet LOW]

When the I/Os of a chip all share the same power and ground rails, which is often the case in small microcontroller devices, designated I/Os can be used as sense lines to measure externally the power rails on the die.

25 July 2022

Signal and Power Integrity Tutorial: How PDN Design Affects Board-level Noise

Figure 1. Oscilloscope traces resulting from  measuring a 3.3. V power rail with a 10x probe versus a coaxial connection, with an adjacent 10x probe acting as an RF antenna.
Figure 1. Oscilloscope traces resulting from 
measuring a 3.3. V power rail with a 10x probe
versus a coaxial connection, with an
adjacent 10x probe acting as an RF antenna.
By Prof. Eric Bogatin,
Teledyne LeCroy Fellow

Excerpted by permission from the Signal Integrity Journal article, Measuring Only Board-level Power Rail Noise May Be Misleading

In our blog, we’ve presented a lot about the impact of the interconnect on oscilloscope measurements, and how where you probe can be as important as how you probe. This article is an excellent demonstration of those very principles.

************************************

Power rail measurements are important because they can identify potential sources of noise before they become a problem. However, measuring only the power rail noise at the board-level may be a misleading indication of the noise the die actually sees. 

Best Practices for Power Integrity Measurements

Measuring a power rail on a board seems like a simple task. Like all measurements, it is easy to get a waveform on the oscilloscope’s screen, but it is difficult to have confidence you have eliminated the measurement artifacts and have a realistic measure of the actual signal present.

18 July 2022

Six Principles of FFT Analysis Using Real-time Oscilloscopes

Figure 1. A 100 MHz sine wave in the time domain and its spectrum in the frequency domain showing the one peak at 100 MHz.
Figure 1. A 100 MHz sine wave in the time domain
and its spectrum in the frequency domain showing
the one peak at 100 MHz. Click on any image to enlarge.
By Prof. Eric Bogatin,
Teledyne LeCroy Fellow

The following piece was published in Signal Integrity Journal and is excerpted here by permission of Signal Integrity Journal.

***************************

We live in the time domain. This is where we measure all digital performance. But sometimes, we can get to an answer faster by taking a detour through the frequency domain. With these six principles, we can understand how an oscilloscope transforms time domain measurements into a frequency domain view. All six principles are applied “under the hood” by oscilloscopes with a built-in FFT function. (Our note: Also by software packages designed for spectral analysis, such as the SPECTRUM-1 and SPECTRUM-PRO-2R options.)

1. The spectrum is a combination of sine wave components

In the frequency domain, the only waveforms we are allowed to consider are sine waves. There are other special waveforms combinations of which can describe any time-domain waveform, such as Legendre polynomials, Hermite polynomials or even wavelets. The reason we single out sine waves for a frequency domain description, is that sine waves are solutions to second order, linear, differential equations—the equations found so often in electrical circuits involving resistor, capacitor and inductor elements. This means signals that arise or have interacted with RLC circuits are described more simply when using combinations of sine waves than any other function because sine waves naturally occur. 

05 July 2022

A Tale of Two Calibrations: Vector Network Analyzer vs. WavePulser 40iX

Figure 1: This sequence diagram of the classic SOLT 2-path calibration shows the order of connections required.
Figure 1: This sequence diagram of the
classic SOLT 2-path calibration shows
the order of connections required. 
It was the best of S-parameter measurements, it was the worst of S-parameter measurements…and the difference was in the calibration.  Calibrating a vector network analyzer (VNA) before making any measurements is required in order to reduce errors from imperfect channel matching, less than optimal directivity in the directional couplers and cable response issues. While VNAs are precisely calibrated at the factory, that calibration only extends to the front panel measurement ports. There will inevitably be drift on the internal paths over time. Also, any cables, adaptors or fixtures connected to the measurement ports must be characterized and de-embedded in order to make exact measurements of the device under test (DUT).  

There are many possible calibration methods depending on the number of ports and paths being measured.  For simplicity, let’s consider the common 2-port, 2-path calibration.  This calibration method will yield a full set of S-parameters for the two ports: S11, S12, S21 and S22.  It requires the use of a short, open, load and through (SOLT) calibration reference standard, along with the cables used in the test setup, as shown in Figure 1.

27 June 2022

Get Ready for PCIe 6.0 Base Tx Testing--Compliance, Jitter and Eye Diagrams

Figure 1. The four levels and three eyes of the PCIe 6.0 PAM4 signal. Click on any image to enlarge.
Figure 1. The four levels and three eyes of the
PCIe 6.0 PAM4 signal.
Click on any image to enlarge.
The PCI Express® 6.0 Base specification was officially released in January 2022 at version 1.0, meaning it is considered final. The CEM and PHY test specifications are currently at version 0.3, and 0.5 versions of both will probably be released sometime in the third or fourth quarter of 2022. As both the CEM and PHY test specifications are still at an early stage, it's hard to predict exactly when the PCIe® 6.0 compliance test program will start, but it's safe to say it is at least a few years out. However, PCIe 6.0 Base testing is upon us, especially those of us working on chip design.

So, what can implementers expect as they retool for PCIe 6.0 Base Tx and Base Rx physical layer testing?

20 June 2022

Is It OK to Use an External 50 Ohm Terminator with an Oscilloscope?

Recently, a reader posed the question in the Comment field on Dr. Eric Bogatin's blog post, How to Choose Between the Oscilloscope's 50 Ohm Input and 1 MOhm Input:  "Is there any difference between using an external 50 Ohm terminator instead of the internal 50 Ohm termination on the oscilloscope--for example, using a RG58/RG174 cable?"

Eric answered:

"In principle, you can use the oscilloscope input set for 1 MOhm termination, then add an external 50 Ohm termination resistor on a BNC Tee connector, for example. This has the advantage that you can actually use any resistor for a load, or terminate signals with an RMS voltage larger than 5 V.

However, there are two problems with using this approach for high-speed signals with rise times shorter than 1 nsec, which require an oscilloscope with bandwidth larger than 1 GHz.

13 June 2022

Oscilloscope Basics: Cal Out and Aux Out

Figure 5. New PCIe 6.0 compliance pattern signal.
Fig. 1: Cal Out and Aux Out 
provide many useful outputs.
Oscilloscopes are generally thought of in terms of the signals that are input to them, but even oscilloscopes that are not equipped with function/signal generators can usually output some useful test signals.

Nearly all oscilloscopes have a Cal Out (calibration output) terminal on the front. Most Teledyne LeCroy oscilloscopes also have an Aux Out (auxiliary output) connector on either the front or back, depending on  model. Both outputs provide configurable signals that can assist you to compensate probes and attenuators, test frequency response, trigger waveform acquisition and coordinate multiple test instruments.

06 June 2022

What Happens When You Connect a USB-C Cable

The USB Type-C® connector is designed to be very simple for the user to use: you insert it in either orientation, and a multitude of services just “work”. Though simple to use, it is a complicated connector to program and test, with a very complex system of protocols behind it. There is USB power delivery (USB-PD) and multiple rates of USB data delivery from USB 2.0 through USB4®, specified by the USB Implementers Forum (USB-IF®). There are protocols other than USB, such as DisplayPort™, High-Definition Multimedia Interface (HDMI™), Peripheral Component Interconnect Express (PCIe®), Base-T Ethernet and Thunderbolt™. 

So, what actually happens when you connect a USB-C cable? To understand that, first let’s take a look at the signals and pin assignments in the USB-C connector receptacle (Figure 1).

Figure 1: The USB-C receptacle pin assignments showing the key signals used for device-to-device communications. Related pins have matching color overlays.

Figure 1: The USB-C receptacle pin assignments showing the key signals used for device-to-device communications. Related pins have matching color overlays.

23 May 2022

Four Essential Oscilloscope Network Security Practices

 Currently manufactured Teledyne LeCroy oscilloscopes utilize either the 64-bit Microsoft® Windows® 10 Professional or 32-bit Microsoft CE platforms to support the oscilloscope application. From a networking perspective, they are for all intents and purposes Personal Computers (PCs).

Using a commonly available computer operating system such as Microsoft Windows on a Teledyne LeCroy oscilloscope offers a multitude of advantages, such as the ability to link third-party software to oscilloscope operations and to connect to a wide variety of hardware. The downside of using a common operating system is the threat of malware. 

Malware (including but not limited to viruses, Trojan horses, worms, bots, keyloggers and spyware) can infect a PC via many paths. Examples include websites, USB memory sticks, emails and your local area network. Simply connecting an unprotected PC (i.e., unprotected Windows-based oscilloscope) to a “compromised” network is enough to infect the PC within seconds. Likewise, a compromised oscilloscope can infect an entire network.

Below, we list four practices Teledyne LeCroy strongly encourages all users to follow to minimize the risks that malware presents. Remember, the time you spend attending to oscilloscope network security is minimal compared to the cost of having to clean up an infected instrument. . .or network!

16 May 2022

Oscilloscope Basics: External, Line and Fast Edge "Triggers"

An oscilloscope trigger synchronizes the oscilloscope timebase to the input signal so that the displayed trace is stable. In digital storage oscilloscopes, while the digitizer runs continuously converting analog voltage/current inputs to digital values, it is the trigger event that defines the “acquisition window,” marking the point where data is stored to acquisition memory, locking the signal data for display, measurement and further processing. 

Figure 1: The trigger setup showing the possible choices for the trigger source.

Triggers are set to fire based on the state of a trigger source waveform. What are commonly known as External, Line and Fast Edge "triggers" are not really different trigger types, per se, but alternative trigger sources.  Figure 1 shows the typical setup options for an Edge trigger, the most commonly used trigger type.  With Edge triggering, the oscilloscope is triggered when the source waveform crosses a user-defined threshold level and slope.  Usually, the source will be analog input channel C1-Cn. However, three other sources can be used to initiate an Edge trigger: an Ext(ernal) input, the Line (mains) power and, on some oscilloscopes, the built-in Fast Edge signal. 

09 May 2022

Signal and Power Integrity Tutorial: Measuring Clock Jitter Sensitivity to Power Rail Noise, Pt. 2

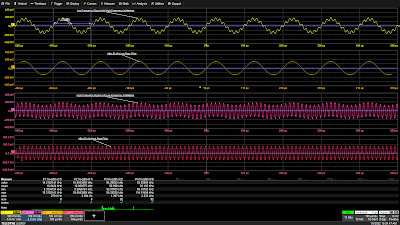
Figure 1. 400 mVpp oscillation on the power trace is due to 48 MHz clock noise.
Figure 1. 400 mVpp oscillation on the power trace
is due to 48 MHz clock noise.

In Part 1, we used a function generator to create a power source with a known perturbation. Seeing that the noise on the power rail and the clock period were synchronous when we observed both traces together using a WavePro HD oscilloscope, we knew that there was a clear relationship between the two to be further investigated. Now, we're ready to examine more closely how the clock jitter responds to voltage variations on the power rail.

02 May 2022

Signal and Power Integrity Tutorial: Measuring Clock Jitter Sensitivity to Power Rail Noise, Part 1

Figure 1. Voltage variations on the power rail shown in the same grid as the clock period track (jitter track). These waveforms are the basis of the clock jitter sensitivity measurement. The inverse relationship between the jitter track and the power trace shows that the clock is sensitive to variations in rail voltage.
Figure 1. Voltage variations on the power rail
shown in the same grid as the clock period track
(jitter track). These waveforms are the basis of
the clock jitter sensitivity measurement. The
inverse relationship between the jitter track and
the power trace shows that the clock
is sensitive to variations in rail voltage.

In a previous post, we described A Robust Method for Measuring Clock Jitter with Oscilloscopes as variation in a clock signal’s period. Clock jitter is characterized by the standard deviation (sdev) of the clock period measurement. The track function of the clock period sdev shows us the variations in jitter over time, synchronous with the waveform source. 

In this post and the next, we’ll show how to make use of the clock period track function to match jitter variations to possible sources of jitter, in particular to voltage variations on the clock power rail. The offset voltage of a function generator powers a clock signal source. By creating a known variation in the function generator output, we can match that to the resulting clock jitter to calculate the clock jitter sensitivity to rail voltage changes. A known clock jitter sensitivity value can help you predict how a design will respond to rail voltage changes.

25 April 2022

Setting Up Your Oscilloscope for EFT Testing

Figure 1: The typical EFT test signal consists of multiple exponential pulses arranged as pulse bursts.
Figure 1: The typical EFT test signal consists of
multiple exponential pulses arranged as pulse bursts.
A third type of electromagnetic compatibility (EMC) testing deals with how devices respond to electrical fast transients (EFT). EFTs are a series of fast, high frequency pulses, often occurring in bursts. These transient events are the result of electrical arcing. EFT pulse bursts occur when a power connection is made or broken, equipment is powered down or circuit breakers are switched. They also occur when inductive loads such as relays, switch contactors or heavy-duty motors produce bursts of narrow high-frequency transients on the power distribution system when de-energized.

The typical compound waveform used for EFT testing is shown in Figure 1.

Figure 2: Acquisition of two EFT bursts at 1.25 GS/s, zoomed to show several timing epochs.
Figure 2: Acquisition of two EFT bursts at
1.25 GS/s, zoomed to show several timing epochs.
The pulse waveform for EFT testing is defined by a risetime of 5 ns and a pulse width of 50 ns. These pulses are combined into bursts of 5 to 50 pulses spaced at from 10 to 100 µs (10 to 100 kHz). The bursts are typically spaced as much as 300 ms apart. Figure 2 shows an EFT test signal, with two EFT bursts captured by an oscilloscope on channel 2 sampled at 1.25 GS/s.

The two EFT pulse burst are shown in the upper left-hand trace (the two pink blocks). A series of zoom-on-zoom traces are opened to show several timing epochs. Trace Z2 (second from top left) shows a single burst. The zooms keep expanding the horizontal scale until finally at Z8 (bottom right) we see a single EFT pulse.

Following are six, important things to do to make sure you get the best EFT test measurements from your oscilloscope.

18 April 2022

Setting Up Your Oscilloscope for Surge Testing

Figure 1: A typical EMC surge test waveform with 1.2 µs rise time and 50 µs half amplitude time. Zoom trace Z1 shows the details of the rise time. Click any image to expand it.
Figure 1: A typical EMC surge test waveform with
1.2 µs rise time and 50 µs half amplitude time.
Zoom trace Z1 shows the details of the rise time.
Click any image to expand it.
Electrical surges result from phenomena like lightning strikes and switching transients.  Electronic devices are subjected to simulated surges to confirm that they continue to operate properly following a surge, just as they are tested against electrostatic discharge. 

Surge pulses are similar to ESD pulses in that they have a very fast rise time, but the fall time is much, much slower. Figure 1 shows a typical surge pulse waveform. Surge testing involves similar measurements to those made for  ESD pulse testing—such as rise time, pulse width and max—but surge testing also requires some additional measurements, such as area under the pulse curve and transmitted charge. 

Figure 2: To verify the surge generator waveform, the oscilloscope is connected to the generator through an attenuator.
Figure 2: To verify the surge generator waveform, the
oscilloscope is connected to the generator through an attenuator.
As with ESD pulse tests, oscilloscopes are primarily used to “test the tester,” confirming the output of the surge generator. So, before a surge generator is hooked up to the device under test, it's required to hook it up to an oscilloscope and conduct a series of measurements to make sure the surge pulse is within specification. Figure 2 shows a typical surge test setup.

Following are three, important things to do to make sure you get the best surge measurements from your oscilloscope.

11 April 2022

Setting Up Your Oscilloscope for ESD Pulse Testing

Figure 1: An ESD calibration test setup.  The ESD gun discharges its waveform into a properly attenuated current target.
Figure 1: An ESD calibration test setup. 
The ESD gun discharges its waveform
into a properly attenuated current target. 
Electrostatic discharge (ESD) pulse tests are a type of conducted immunity testing done to confirm that a device can withstand a sudden transient electrostatic discharge. It is done by using an ESD gun to shoot a pulse of the required voltage at a device while testing that the DUT continues to operate properly. The ESD pulse shape simulates a person, carrying a static charge, touching a device. When their fingertip first touches the device, there is a leading edge with a high peak and fast decay, often visible in the real world as a spark flying from the fingertip. This is followed by a second edge due to the charge in the rest of the human body that propagates toward the fingertip with a time delay.

Oscilloscopes are most often used to “test the tester” in ESD pulse test setups, confirming that the pulse from the ESD gun is the right shape and meets the requirements of the standard to which the device is being tested. A typical calibration test setup is shown in Figure 1. The pulse from the ESD gun is fired directly into a current shunt target connected to the oscilloscope through an attenuator required to keep the signal within the limits of the oscilloscope’s 50 Ω input, which is used for this testing. Then, key parameters of the ESD pulse are measured per one of several standards, such as IEC 61000-4-2.  

ESD standards require a range of measurements. The most common are the initial edge 10% to 90% rise time, peak amplitude, pulse width, amplitude and current levels at specified times from the initial edge (e.g., T1 and T2), and time to half value. 

Following are four, important things to do to make sure you get the best ESD pulse measurements from your oscilloscope.

04 April 2022

Oscilloscope Basics: When to Use Trend to Graph Oscilloscope Measurements

Figure 1: Applying the Trend operator to the same input waveform illustrates how the Trend is asynchronous to the input waveform.
Figure 1: Applying the Trend operator to the
same input waveform illustrates how the
Trend is asynchronous to the input waveform.  
In a previous post, we described the characteristics of the Track math function and two key applications of using Tracks to graph oscilloscope measurement data: anomaly detection and waveform demodulation. In this post, we'll discuss the characteristics and uses of the Trend function.

To illustrate an important distinction between Tracks and Trends, the Trend math operator in Figure 1 is now applied to the same signal as was the Track in our previous post without first reacquiring the input waveform. 

Note that unlike a Track, the Trend is not time-synchronized to the input waveform. Only the order of events, and not the timing of events, is retained. The underlying shape of the Track may be displayed in the Trend because the same measurement values from a single acquisition are displayed in the same sequence—however, the timing information of when each of the values has occurred is not retained in the Trend. Therefore, unlike the Track, the Trend does not point to the location of an anomaly. Without time scaling, the Trend does not have the frequency information needed to demodulate an input waveform.

28 March 2022

Oscilloscope Basics: When to Use Track to Graph Oscilloscope Measurements

Figure 4: The Trend (green) retains a history of pulse widths, while the Track (blue) shows only a flat line corresponding to the most recent width.
Figure 1: Pulse Width Modulated waveform (yellow)
and Track math operator (blue),
where the X-axis scaling is identical for both.
Modern oscilloscopes contain many tools that can be used for analyzing data, including Track and Trend math functions. Both Tracks and Trends graphically display measurement results and locate anomalies. The main similarity between Tracks and Trends is that the Y-axis of both operators is the measurement parameter itself (for example, Pulse Width, Duty Cycle, Rise Time, Slew Rate, etc.). The main difference between the two math operators is their X-axis, in which the Track uses the identical X-axis and synchronous horizontal scaling as the input waveform, whereas the Trend uses units of chronology. A Track, in essence, is a waveform of the measurement values. A Trend is a data logger showing the history of change in measured parameter values, but points are not necessarily synchronous with the measured waveform.

Use Tracks for Anomaly Detection

The Track provides valuable debugging information by directly pointing to an area of interest. 

Notice the negative-going spike in the Track waveform in Figure 1. Figure 1 occurs at the point in time where the input waveform reaches its most narrow pulse width, and the Track instantly finds it, indicating when one measurement deviates from the others in the graph. The Track identifies the exact location in time where the narrowest or widest pulse width has occurred, and fully describes the measurement changes occurring throughout the entire waveform. Since oscilloscopes can acquire thousands or even millions of waveform edges within a single acquisition, the Track allows an engineer to quickly "find the needle in a haystack".

21 March 2022

PCI Express 4.0 Error Detection Using a BERT and Oscilloscope

Figure 1: BERT and Oscilloscope connection for PCI Express 4.0 error detection.
Figure 1: BERT and Oscilloscope connection
for PCI Express 4.0 error detection.
The PCI Express® 4.0 standard specification requires an oscilloscope with at least 25 GHz analog bandwidth and a BERT which can test bit rates of at least 16 Gbps. The BERT provides a known input pattern to the PCIe® device under test (DUT), and the DUT is instructed to regenerate the identical bit pattern while placed in loopback mode. Since a BERT can output a signal when a bit error is detected, this signal can be input to the oscilloscope to trigger a synchronized capture when an error occurs. By combining the capabilities of these two instruments, a powerful combination of real-time error detection and characterization can emerge.

Connecting the Instruments

In Figure 1, a known pattern is connected from the BERT PPG D1 output to the PCIe DUT input via a 2.92 mm K-type cable. The DUT attempts to regenerate the same data pattern, while the DUT output is routed to both the BERT error detector input and the oscilloscope channel 1 via 2.92 mm K-type tables and a power splitter. An error-free reference signal is connected between the BERT D2 output to the oscilloscope channel 2, along with the error trigger signal from the error detector output to the oscilloscope channel 3. An oscilloscope Edge trigger is set on the rising edge of the error detector output signal on C3.

14 March 2022

WavePulser 40iX vs. Time Domain Reflectomer (TDR) or Vector Network Analyzer (VNA)

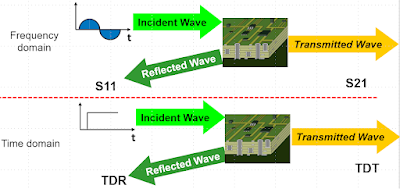
Figure 1: S-parameters and TDR responses are two means to the same end, characterizing interconnects.
Figure 1: S-parameters and TDR responses are two means to
the same end, characterizing interconnects.
Oscilloscopes are used to measure signals, usually as voltages vs. time, and signals come from active devices. But interconnects are passive structures that don’t produce their own signals. To characterize interconnects, you need a stimulus-response system.

There are two, principal types of stimulus-response systems used to characterize interconnects: Vector Network Analyzers (VNAs) used to measure S-parameters in the frequency domain, and Time Domain Reflectometers used to measure impulse responses in the time domain. Each uses a different type of incident signal and a different formalism, but as long as the interconnect is linear, passive and time invariant, both S-parameters and impulse responses yield the same information content in different formats and can be translated from one into another.

So, which do you need? We’ll look briefly at what each does and what are the criteria that might require you to have one versus the other.

07 March 2022

Configuring Dynamic Oscilloscope Measurements Using Advanced Customization

Figure 1. The Advanced Customization option lets you seamlessly and continuously update the input of one parameter with the output of another.
Figure 1. The Advanced Customization option
lets you seamlessly and continuously update the
input of one parameter with the output of another.
With the installation of the Advanced Customization (XDEV) option on Teledyne LeCroy MAUI® oscilloscopes, you can create a measurement parameter whose input value is dynamically updated with each new trigger by the output value of another measurement parameter. All that is required is three simple lines of VBScript. 

To demonstrate, we’ll use the example of taking the x@max value measured on each acquisition and using it to dynamically populate the X position used by the measurement parameter lvl@x. However, these principles could be applied to any two parameters that share a logical/mathematical relationship, or to a parameter and a math function (for example, to use the output of a parameter as the multiplier for a Rescale function).

28 February 2022

Signal and Power Integrity Tutorial: A Robust Method for Measuring Clock Jitter with Oscilloscopes

Figure 1. Clock jitter measured as a variation of clock signal absolute period.
Figure 1. Clock jitter measured as a variation
of clock signal absolute period.
Clock jitter is the variation of a clock signal’s frequency or period. Either measurement carries the same information, but the period measurement is a simple time interval measurement easily performed using a real-time oscilloscope. If we have a robust way of measuring clock jitter, we have the basis for measuring the clock signal’s sensitivity to other features in the environment that can affect the period. Voltage noise on the power rail is just one external force that can affect clock jitter, which we'll show you how to measure in a future post.

In this post, we’ll demonstrate a robust method for measuring clock jitter using an example from Dr. Eric Bogatin’s webinar, “The Impact of Power Rail Noise on Clock Jitter.”  

The clock in our examples is a 5-stage ring oscillator which generates a square wave signal between 10 and 66 MHz. The test instrument is a WavePro HD 12-bit, 4-Ch, 8 GHz, 20 GS/s, 5 Gpts oscilloscope with 60 fs sample clock jitter.

In the process, we make a series of oscilloscope sample clock tests and timebase adjustments as  consistency checks. While measuring jitter is less about absolute accuracy than about the relative precision of measuring the time interval from cycle to cycle, a fundamental part of that is ensuring the absolute accuracy of the oscilloscope’s timebase.

21 February 2022

9 Important Things to Know When Making Sensitive Measurements with Oscilloscopes

We've routinely posted on how you can characterize your total measurement system to gain important "situational awareness" when using an oscilloscope to make sensitive measurements. The knowledge gained from these tests helps you properly interpret your measurement results so that you can deduce what is actually going on with your circuit, versus what is an artifact of the measurement system. Listed here are nine important things you should know before making sensitive measurements with your oscilloscope, with links to blog posts that instruct you how to test them.

14 February 2022

Transmission Lines for Oscilloscope Users, Part 4

Figure 1: Characteristic waveform when the source impedance is lower than the cable impedance.
Figure 1: Characteristic waveform when the source
impedance is lower than the cable impedance.
In Part 3, we saw the pattern of reflections that occur when both the source impedance and the oscilloscope input impedance are higher than that of the interconnect, and how those reflections affected the rise time measurement. Now let’s briefly consider what happens when the source impedance is lower than the impedance of the connecting cable. 

For this example, the source voltage is a 3.3 V square wave and the source impedance is 9 Ω. As before, our transmission line is a 50 Ω coaxial cable connecting the source to the oscilloscope. If the oscilloscope input termination is set to 1 MΩ, we see the interesting waveform shown in Figure 1.

07 February 2022

Transmission Lines for Oscilloscope Users, Part 3

Figure 1: The Thevenin equivalent circuit model can be used to characterize a voltage source with respect to the  interconnect cable and oscilloscope input termination.
Figure 1: The Thevenin equivalent circuit model can be used
to characterize a voltage source with respect to the 
interconnect cable and oscilloscope input termination.
In Part 2, we demonstrated how to calculate the instantaneous impedance of a transmission line. However, any measurement made using an oscilloscope should consider not only the transmission line, but the source, the transmission line and the oscilloscope as a system. Therefore, characterizing your source, as well as knowing the effects of your oscilloscope input impedance, is important to developing the “situational awareness” needed to interpret measurements properly.

Two terms needed for us to characterize the source are the Thevenin source voltage and the Thevenin source resistance. Once we know these, we have all the pieces we need to fully understand what is happening with our measurements. This is true whether the signal source is a Cal terminal or a device-under-test.

31 January 2022

Transmission Lines for Oscilloscope Users, Part 2

Figure 1: A transmission line can be seen as a series of "buckets" of capacitance charged to a voltage by the signal as it "walks the line."
Figure 1: A transmission line can be seen as
a series of "buckets" of capacitance charged
to a voltage by the signal as it "walks the line."
In Part 1, we experimented with the signal rise time measurement and saw that it appeared to increase substantially as the length of the interconnecting cable was increased. To understand why, we revisited some basic principles of signal integrity:

1. All interconnects are transmission lines. 
2. Signals are dynamic, and once launched, cannot be prevented from propagating down the transmission line.

Be the Signal

To illustrate the dynamic nature of signals, imagine a very simple, 1 ns long, 50 Ω impedance transmission line. As a 1 V signal is launched into the transmission line and propagates, at each step along the way it asks "What's the impedance of the environment?" at its leading edge. That is the instantaneous impedance, notated as Z. Impedance is always defined as the ratio of a voltage to a current. We know the voltage of this signal (1 V), but how do we find the current at the edge? 

24 January 2022

Transmission Lines for Oscilloscope Users, Part 1

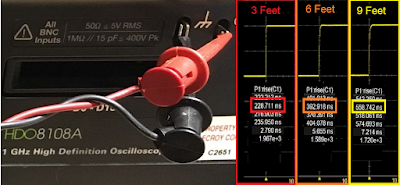
Figure 1: The rise time of the Cal signal seems to increase significantly by increasing the length of the interconnect cable. Is it true? Click image for details.
Figure 1: The rise time of the Cal signal seems to
increase significantly by increasing the length of the
interconnect cable. Is it true? Click image for details.
This post is the first of a series that will discuss what every oscilloscope user needs to know about transmission lines. It is going to introduce you to the absolutely most important signal integrity principles everybody needs to know when using an oscilloscope to measure signals with rise times shorter than 10 nanoseconds. After demonstrating some easily misinterpreted measurements, we’re going to look “under the hood” at what’s really happening to show you how it's all about the principles of transmission lines. Awhile back, Dr. Eric Bogatin offered a condensed version of What Every Oscilloscope User Needs to Know About Transmission Lines that summed up the key takeaways, but by revisiting “Transmission Lines 101” with us here, we’ll hopefully also show you a different way of thinking about your measurements.

17 January 2022

9 Quick Fixes to Improve DDR Probing

Figure 1: Reversed Handsfree mounts and chip clips help relieve strain on fragile solders.
Figure 1: Reversed Handsfree mounts and chip
clips help relieve strain on fragile solders.
Probing at DRAM pins as required by JEDEC can be challenging. Here are nine, simple ways to improve your DDR probing.

1. Use positioning tools to relieve strain on probe tips

The Handsfree probe holder included as an accessory with several Teledyne LeCroy probes, such as the WaveLink and DH Series probes, was originally designed to put weight on the probe tip to ensure a good contact. However, many DDR probing applications utilize solder-in (SI) tips, where the greater concern is to relieve strain on the tip so as to not disrupt the solder. It turns out that if you use the Handsfree in a “reverse mounted” orientation (Figure 1), it puts the amplifier in a perfect position to help relieve strain on probe tips.

10 January 2022

Oscilloscope Basics: Stabilizing Waveform Display, Pt. 2

Figure 1: A 50 kHz low-pass filter eliminates a 93 kHz interfering signal from a 10 kHz signal (top two grids) and a 50 kHz high-pass filter cleans up a 93 kHz signal with an additive 10 kHz interfering signal (bottom two grids). Click image to expand.
Figure 1: A 50 kHz low-pass filter eliminates a
93 kHz interfering signal from a 10 kHz signal (top two grids)
and a 50 kHz high-pass filter cleans up a 93 kHz signal
with an additive 10 kHz interfering signal (bottom two grids).
Click image to expand.
In Pt. 1, we discussed the fundamental cause of unstable waveform displays. In this post, we’ll discuss how to use signal conditioners and conditional triggering to help the oscilloscope ignore extraneous samples when determining where the acquisition trigger event actually occurs.

Coupling 

In the Setup section of the Trigger dialog, Trigger input sources can be conditioned using AC or DC coupling, high-pass filters (LFREJ for low-frequency reject) and low-pass filters (HFREJ for high-frequency reject). The frequency selective coupling paths are used to attenuate extraneous signals. The low-frequency reject inserts a 50 kHz high-pass filter in the trigger signal path, which is useful for eliminating low-frequency interference such as 60 Hz power mains signals. This low-frequency noise can cause erroneous triggers, resulting in an unstable display. The high-frequency reject inserts a 50 kHz low-pass filter. This coupling mode finds use in applications such as troubleshooting switch-mode power supplies, where it suppresses signals at the power supply switching frequency. Like any extraneous signal, high frequency pickup can leak into the input signal and cause trigger instability. Figure 1 provides examples of how the HFREJ and LFREJ coupling filters eliminate interfering signals from the trigger source.