 |
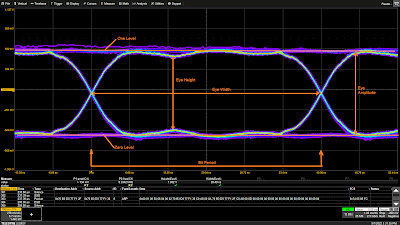
| Figure 1. The 10Base-T1S TDME option features easy eye diagram creation for signal integrity analysis. Click on any image to enlarge it. |
The eye diagram is a general-purpose tool for analyzing serial digital communications signals. It shows the effects of additive vertical noise, horizontal jitter, duty cycle distortion, inter-symbol interference, and crosstalk on a serial data stream.
The eye diagram is formed by overlaying repetitive occurrences of slightly more than a single clock period (UI) of a serial data signal on a persistence display which shows the accumulated history of multiple acquisitions, as shown in Figure 1.
Due to the use of Differential Manchester encoding (DME), the 10Base-T1S eye is formed with twice the signal clock rate. The signal shown has a symbol rate of 12.5 Mbps and the eye is clocked at 25 Mbps.
DME is a bipolar encoding scheme where a logical one is represented by transition (of either polarity) in the middle of a bit period. A logical zero is represented by the absence of a transition during the middle of a bit period. DME encoding is illustrated in Figure 2.
 |
| Figure 2. Differential Manchester (DME) encoding used in 10Base-T1S. |
DME uses a transition of either polarity during the middle of a bit period to indicate a logical 1 and the lack of a transition to signal a logical 0. The vertical blue dotted lines indicate the bit periods. The logical 1 signals break the bit period in half, so evaluating the eye requires the double symbol rate.
 |
| Figure 3. An annotated view of the 10Base-T1S eye diagram showing the significant eye parameters. |
Based on this information we can take a closer look at the 10Base-T1S eye diagram shown in Figure 3.
The bit period is 40 ns corresponding to the bit rate of 25 Mbps. This is the effective symbol rate for the DME signal. The data source for the eye diagram can be user selected to be the entire acquisition or a zoom of a selected data packet.
There are several measurement parameters that help characterize eye diagrams:
Zero Level - The mean value of the logical 0 level of the eye diagram.
One Level - The mean value of the logical 1 level of the eye diagram.
Bit Period - The reciprocal of the effective symbol rate.
Eye Amplitude - A measure of the overall amplitude of the eye. It is based on the difference between the simple mean of the one level and the simple mean of the zero level. It is generally measured near the center of the eye.
Eye Height - This is a measurement of the minimum vertical eye opening; basically, a determination of the signal to noise ratio. The measurement is made by taking the difference of the means of the one and zero levels then subtracting three times the standard deviation of each level.
Eye Width - The eye width gives an indication of the total horizontal jitter in the signal. Like the eye height the measurement is statistical in nature. The horizontal histograms of two adjacent crossing points are used to determine the mean and standard deviations of crossing times. Three times the standard deviation of each distribution is subtracted from the difference of the two mean values.
When enabled for the 10Base-T1S eye diagram, the eye height and eye width are displayed immediately below the eye diagram.
 |
| Figure 4. Two vertical effects on the eye. The first pulse in the packet SSD field has noticeable vertical overshoot and droop, and Node ID #0 and ID #3 have differing zero levels. |
The vertical opening of the eye is affected by vertical related elements like additive noise and cross talk and other interfering signals as well as gain differences between devices on the bus. As an example of these vertical effects, consider the eye diagram of a 10Base-T1S packet shown in Figure 4.
This eye diagram is using color persistence where the more frequent occurrences appear in the brighter colors. The violet trace (samples with a low occurrence rate) at the top has a high one level related to the first bit in the SSD field of Node ID #3. It is a zero and so appears as a double width segment.
The other thing to notice is that the zero levels of the two nodes on the bus do not match exactly. The node with ID #0 has a higher zero level, which has the effect of decreasing the eye height. The measured eye height of 932 mV and eye width of 39.35 ns includes data from both nodes.
The eye diagram shown is based on the full acquired signal and sees both nodes on the bus. The user can elect to generate the eye diagram for only the displayed zoom trace associated with the selected packet in the decode table, rather than the full acquisition. In this way, the source of any aberrations noted in the full acquisition can be isolated, first by selecting a specific packet, then shifting the zoom trace horizontally until the aberration disappears.
The horizontal closure of the eye is the result of timing uncertainty. Timing jitter whether random, periodic or inter-symbol interference will tend to close the eye horizontally. Both nodes have common timing with no apparent horizontal differences.
Also see:
Oscilloscope Measurements of 10Base-T1S Automotive Ethernet PLCA Cycle Timing
Physical-Layer Collision Avoidance in 10Base-T1S Automotive Ethernet
No comments:
Post a Comment