 |
| Figure 1. Serial bus measurements made available with "TDME" and "TDMP "decoder options. |
What’s in a Name?
Teledyne LeCroy has adopted the convention of using a key in the name of our serial trigger and decode products that tells you what capabilities they offer. The “ME” or “MP” in the name of a Teledyne LeCroy serial decoder option (e.g., CAN FDbus TDME or USB4-SB TDMP) refers to "Measure/Graph and Eye Diagram" or "Measure/Graph and Physical Layer Tests." All these options include the following 10 serial bus measurements. Physical Layer Test options will also include measurements designed specifically to meet the requirements of the standard.
Measure Serial Bus Performance and Timing
These parameters are key to understanding the performance of digital bus traffic.
Bus Load computes the load of selected messages on the bus (as a percent of total).
Message Bitrate computes the bitrate of selected messages.
Number of Messages computes the total number of messages in the decoding that meets filter conditions.
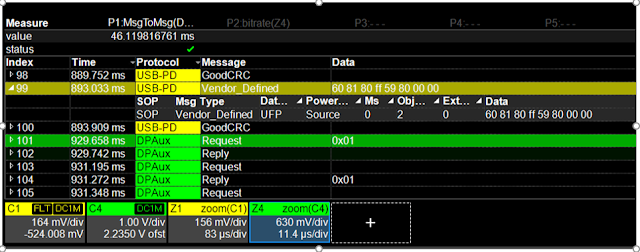
Message to Message computes the time from the start of the first message that meets filter conditions to the start of the next message in the same or different decoding that meets filter conditions.
Delta Message computes the time difference between two messages on a single decoded bus line.
Time at Message computes the time from acquisition trigger to the start of each message that meets filter conditions.
These parameters let you measure the decoded digital data against the state of a second, analog signal. They are especially useful for measuring serial data against a clock signal or a power rail voltage.
Message to Analog computes the time from the start of the first message that meets any filter conditions to an amplitude/voltage level on an analog signal.
Likewise, Analog to Message computes the time from an amplitude/voltage level on an analog signal to the start of the first message that meets any filter conditions.
Convert Digital Message to Analog Values (Serial DAC)
 |
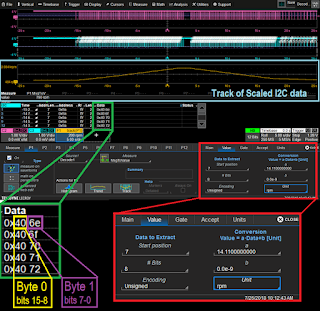
| Figure 2. Example parameter setup for serial DAC of embedded sensor data. |
Message to Value extracts a selected portion of the decoded data to a measurement parameter location, with optional conversion of the value to a different scale and/or unit. The extracted data may be selected by ID and/or data field position. The parameter can in turn be plotted as a histogram, track or trend graph, or used in a Math on Parameters formula.
View Serial Encoded Data as Analog Waveform sets up a Message to Value parameter and track graph in one step.
An example of using these parameters as a serial DAC is described in Correlating Sensor and Serial Data in Complex Embedded Systems, where digitally encoded fan speed data is extracted from decoded serial messages using the Message to Value parameter, converted to temperature, then plotted as a track waveform showing the temperature fluctuations over time. A great advantage of using the TDME software for this is that the extracted analog waveform is time synchronous with the decoding, allowing you to view them side by side and correlate events.
Besides plotting the extracted values as a graph, Measure to Value can act as a “pass through” of those values to other measurement parameters or math functions by selecting the Message to Value parameter as a source.
Easily Graph Serial Data Measurements
Any serial data measurements, not just the serial-analog parameters, can be plotted as a histogram, track or trend graph for statistical analysis. The output graph can be selected right on the dialog where the parameter is set up.
 |
| Figure 3. Graphs can be selected right on the dialog where measurement is set up. |
Histogram plots a bar chart of the measured values, which shows the statistical distribution of measurements.
Track acts like a strip-chart recorder, plotting one measurement value per digital sample. It is the track graph of extracted serial data that can be used to recreate an original analog waveform.
Trend plots the history of change in a parameter, allowing you to see if variation is periodic or random.
The use of graphs for statistical analysis is described in Measuring Dead Time in 48 V Power Converters, Part 2: Dynamic Measurements.
Filter Measurements by Device, Data Types/Values or Acquisition Time
Any serial bus measurements and graphs can be performed on all decoded data, or on only data that meets your filter criteria, allowing you to target the measurements and graphs to particular devices or transmission types.
The first level of filtering, the selection of packets by device ID or ID plus data pattern found in the decoding, is done as part of the initial parameter set up. Only those packets matching the filter criteria are included in the measurement. Filtering is not required: the selection of “Any” will apply measurements to the full decoding.
The next level is to filter a particular column of the measurement results table to display only values that meet a set of Boolean criteria. This method is demonstrated in Oscilloscope Measurements of 10Base-T1S Auomotive Ethernet PLCA Cycle Timing, where by filtering the table to show only packets with the value BEACON in the transmission Type column, the serial measurements reflect the performance of the Master node on the bus.
If you filter the Time column, you can apply the measurements only to a particular acquisition time.
Finally, the “Apply to Zoom” feature acts as another layer of filter, focusing the measurements on only those packets that meet all the above criteria and are currently selected from the result table. The act of selecting a row of the table creates a “zoom” of that region, and if “Apply to Zoom” is checked, measurements (and eye diagrams) apply to only the active zoom trace, rather than the entire decoding. In this way, measurements can be made packet to packet as you step down each row of the table.
 |
| Figure 4. "Apply to Zoom" redraws eyes and recalculates measurements as different packets within the same acquisition are selected from the table. |
Note: Eye diagrams, discussed in Serial Trigger, Decode, Measure/Graph and Eye Diagram: Oscilloscope Eye Diagrams for Debug, are another visualization tool included with “ME” and “MP” options. Although they do not graph measurement results, eye diagrams can be used to visually assess the signal integrity of a serial data stream.
Easily Navigate the Decoded Acquisition
The same interactive table that can be used to “zoom” and filter data can also be used as a way to navigate the acquisition, allowing you to quickly bring focus to regions of the total acquisition simply by selecting a row of the table.
If more than one decoder is active, the decoded packets are sequentially interleaved on the table, so you can quickly see the relative timing of two buses or messages in two protocols riding on one bus (the image below shows USB-PD and DP-Aux traffic over a single USB-C connection). Touching the Index cell let's you "drop-in" the detailed decoding.
 |
| Figure 5: P1 Message to Message parameter shows timing between interleaved USB-PD and DP-Aux messages, while the details of row 99 are "dropped" into the table display by touching the Index cell. |
Teledyne LeCroy Serial TDME and TDMP options are the Gold Standard in serial bus analysis software, giving you unparalleled ability to access and analyze the content of serial data messages.
To learn more about how you can apply serial data measurements and graphs, see our free, on-demand webinar, How to Use an Oscilloscope as a Serial Digital-to-Analog Converter (DAC) for Validation and Debug
Also see:
TDME Primer: Automated Timing Measurements of USB-C Protocols
Measuring Dead Time in 48 V Power Converters, Part 2: Dynamic Measurements
Getting The Most Out Of Your Oscilloscope: Cursors and Parameters
No comments:
Post a Comment