You need to test, we're here to help.

You need to test, we're here to help.

30 December 2014

Filtering Signals with MATLAB

A 2-pole, 1-MHz Butterworth low-pass filter applied to an acquired waveform
Figure 1: A 2-pole, 1-MHz Butterworth low-pass filter
applied to an acquired waveform
Touted by its maker as "the language of technical computing," The MathWorks' MATLAB is a veritable Swiss Army knife for engineers, scientists, and perhaps anyone involved in technical endeavors. MATLAB serves a myriad of applications in programming, data analysis, application development, modeling and simulation, and... wait for it... instrument control!

17 December 2014

What S-parameters Reveal About Interconnects (Part III)
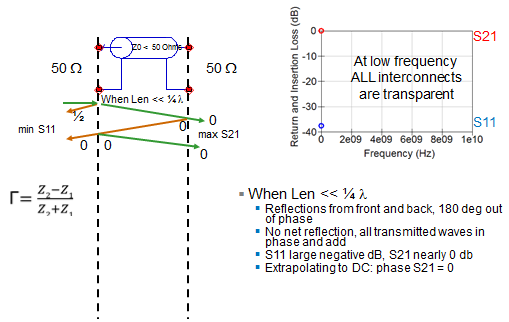
How ripple is introduced into S11 and S21
Figure 1: How ripple is introduced into S11 and S21
S-parameters are a great tool for understanding exactly what happens to a signal as it traverses an interconnect such as a transmission line. How much of it propagates through, and how much reflects off of impedance mismatches? From plotting return loss against insertion loss, we've weighed how much return loss may be tolerable before it significantly impacts insertion loss. Now we'll turn our attention to some common patterns exhibited by S11 and S21 and what they mean to the performance of an interconnect.

09 December 2014

What S-parameters Reveal About Interconnects (Part II)

Measuring S-parameters of a two-port interconnect
Figure 1: Measuring S-parameters
of a two-port interconnect
Having previously covered some of the fundamentals of S-parameters, it's now time to dig a little deeper into what they can show us about an interconnect; say, for example, a two-port microstrip line on a PC board. Unlike the one-port DUT in our earlier post, this configuration gives us the opportunity to look at not only S11 (return loss or reflected signal), but also S21 (insertion loss or transmitted signal).

03 December 2014

What S-Parameters Reveal About Interconnects

S-parameters are derived by applying an incident wave to an interconnect
Figure 1: S-parameters are derived by applying an incident
wave to an interconnect; we can consider this process in either
the time or frequency domains
S-parameters are a popular means of characterizing an interconnect. By feeding the interconnect with a precision reference signal and measuring how much of that signal propagates through the connector and how much is reflected, we learn everything we need to know about its performance. This will be the first in a series of posts about the insights we can glean from S-parameters with practical examples of common measurement scenarios.

14 November 2014

An Under-the-Hood View of PCIe 3.0 Link Training (Part I)

An overview of the elements of PCIe 3.0 dynamic link equalization
Figure 1: An overview of the elements of PCIe 3.0
dynamic link equalization
Now that we've looked at the basics of PCIe 3.0 dynamic link equalization and at some of the particulars of de-emphasis and preshoot, it's time to dive a little deeper into what actually happens in the link training process. It all happens in the blink of an eye but there's enough going on to warrant some dissection.

10 November 2014

PCIe 3.0 Dynamic Link EQ: De-Emphasis, Preshoot, Cursors, and Presets

De-emphasis, a key transmit-side equalization technique for PCIe 3.0, boosts high-frequency content
Figure 1: De-emphasis, a key transmit-side equalization
technique for PCIe 3.0, boosts high-frequency content
In an earlier post, we looked at some of the basics of dynamic link equalization for PCIe 3.0, and in particular the reasons why it's not only necessary but mandated by the PCI-SIG for compliance testing. Essentially, the boost in data rates from 5 GT/s in PCIe 2.0 to 8 GT/s in PCIe 3.0 wreaked havoc in terms of signal integrity in the channel. The solution is found in equalization both before (TxEQ) and after (RxEQ) the channel.

06 November 2014

The Hows and Whys of PCIe 3.0 Dynamic Link Equalization

SI problems are the root cause for dynamic link equalization in PCIe 3.0
Figure 1: SI problems are the root cause for
dynamic link equalization in PCIe 3.0
If you're designing a computer peripheral these days, chances are that you'll use the Peripheral Component Interconnect Express (PCIe) protocol for communication between the device and the host system. With the emergence of PCIe, a bunch of older bus standards were kicked to the curb. PCIe itself became the basis for more specialized standards, most notably ExpressCard for laptop expansion cards and SATA Express for storage interfaces.

15 October 2014

DDR Memory Testing Part IV: Preparing for Testing

For compliance testing, DDR transition density should be as high as possible
Figure 1: For compliance testing,
DDR transition density should
be as high as possible
The first three installments of this series of posts on DDR memory testing are largely concerned with mechanical issues related to probing, use of interposers, and/or damping resistors. Now, we will turn our attention to the preliminaries of DDR testing itself: generating DDR traffic with which to exercise the memory interface, and criteria for a proper read/write burst pattern that will gain good test results.

08 October 2014

DDR Memory Testing Part III: What Not to Do

Damping resistors on solder-in probe tips  terminating at chip interposer
Figure 1: Damping resistors on
solder-in probe tips
Testing of dual data-rate memory (DDR) devices and/or modules calls for careful application of some best practices for probing. There will also be cases where the use of chip interposers is called for. Heeding the advice provided in earlier Test Happens posts on this topic will go a long way toward successful probing and testing.

01 October 2014

DDR Memory Testing Part II: Using Interposers

The anatomy of a chip interposer
Figure 1: The anatomy of a chip interposer
If you're a PCB layout designer, you've probably heard one or more test engineers complain: "Why can't you lay out the board so that it can be tested?" All too often, components that need to be accessible to oscilloscope probes are physically inaccessible, whether it's because of close proximity of adjacent components or ball grid array (BGA) mounting of the DUT. It's nearly always a necessary evil, though, because of PCB cost and/or mechanical constraints.

24 September 2014

Eliminate Pitfalls of DDR Memory Testing


DDR test configuration for a desktop computer
Figure 1: DDR test configuration
for a desktop computer
Since its inception as a standard in the mid 1990s, dual data-rate (DDR) SDRAM memory has been near ubiquitous in computing applications. Compared to single data-rate SDRAM, the DDR SDRAM interface makes higher transfer rates possible by more strict control of the timing of the electrical data and clock signals.

05 September 2014

Oscilloscope Basics: Using The Display Graticule

The oscilloscope display graticule
Figure 1: The display graticule, the grid of intersecting lines
overlaying the signal display area, is the original
oscilloscope measurement tool
Today's digital oscilloscopes come packed with an abundance of measurement capabilities, all available at the touch of a button or two. Want to know the amplitude of a square wave? Easy. Want to know the standard deviation of that amplitude? Minimum/maximum or mean? All easily compiled for you over hundreds or thousands of acquisitions.

20 August 2014

Go Back to School on Signal Integrity

No matter how much we might think we know about signal integrity, there's always more to learn. The laws of physics never change but we might come across new scenarios in which to apply them. Circuits with higher levels of functionality are constantly being squeezed into smaller, more portable spaces; the closer together we pack active components and transmission lines, the more acute their sensitivity is to electromagnetic energy. Everything's either a transmitter or a receiver in some sense and everything has effects on other components, intended or otherwise.

05 August 2014

Oscilloscope Basics: History Mode

Initial setup of WaveSurfer 3000 oscilloscope
Figure 1: Initial setup of WaveSurfer 3000 with a
2-MHz pulse waveform fed into Channel 1
Back in the day, one of the biggest deficiencies of early digital oscilloscopes was their lack of memory depth. A memory of 500 or 1000 points was about as good as it got, and this didn't provide much in the way of detailed waveform capture. Today's instruments are very different animals; for example, Teledyne LeCroy's recently introduced WaveSurfer 3000 oscilloscopes offer up to 10 Mpoints of memory per channel.

30 July 2014

Video: WaveSurfer 3000 and the MAUI User Interface

Oscilloscopes are often an engineer's best friend, but that can change depending on how easy or difficult a given instrument is to use. Sure, the oscilloscope's capabilities and technical specs are critical, but if the machine is difficult or non-intuitive to interact with, the user ends up wasting time figuring out what should be simple.

24 July 2014

How Many Channels is Enough?

Figure 1: A switch-mode power supply driving a fixed load
can be designed and optimized specifically for that load.
The bulk of oscilloscope applications are well served by instruments with four analog input channels. Most basic debugging and design-related work involves probing of only one signal at a given time, and occasionally more than one, especially when differential signals are concerned. Thus, many users may never see a need for an oscilloscope with more than four channels.

Having said that, there are some applications that by their very nature surpass four channels. Moreover, some of these applications concern circuits and devices that are produced in extremely high volumes. A case in point is switch-mode power supplies, such as those typically found in notebook PCs, tablets, or embedded systems.

18 June 2014

Applying Selective Averaging to Waveform Acquisitions

Figure 1: Using pass/fail testing to average only those
waveforms which are inside the tolerance mask
In the course of using an oscilloscope, there are likely to be times when you'd like to separate pulses based on wave shape or some parametric value and average only those pulses that meet some criteria. Teledyne LeCroy's oscilloscopes, and others, provide pass/fail testing using masks and/or parametric readings to qualify waveforms before they're added into an average or other processing function. Let's take a look at how this works on a Teledyne LeCroy oscilloscope.

09 June 2014

Video: Vertical Controls on the HDO Oscilloscopes

Here's another in our continuing series of tutorial videos. This time, we'll review the use of the vertical controls on a Teledyne LeCroy HDO oscilloscope. These controls facilitate positioning and scaling of waveforms vertically on the oscilloscope's display. Note that although we're demonstrating these controls on an HDO, you'd be rather hard pressed to find an oscilloscope from any manufacturer without a volts/div and vertical offset control. Thus, this video is applicable to whatever oscilloscope you have on your bench.

There are quite a few tutorial videos for a broad range of Teledyne LeCroy products on our YouTube channel. Head on over whenever you need a refresher!


22 May 2014

The Effects of Passive Probe Ground Leads

Teledyne LeCroy's PP108, a representative passive probe
Figure 1: Teledyne LeCroy's PP108,
a representative passive probe
When you open the box containing your shiny new oscilloscope, one of the items you'll likely find inside is a set of basic 10:1 passive probes (Figure 1). Those probes have a ground lead that you'll want to use when you make measurements. Your probe has a bandwidth specification that's probably somewhere between a few hundred megahertz to 1 GHz; that spec was obtained at the factory with a specialized test jig having a specific ground inductance and source impedance. Now, the way in which you connect your ground lead can have a big impact on the real-world bandwidth and response of the probe.

15 May 2014

Back to Basics: S-parameters
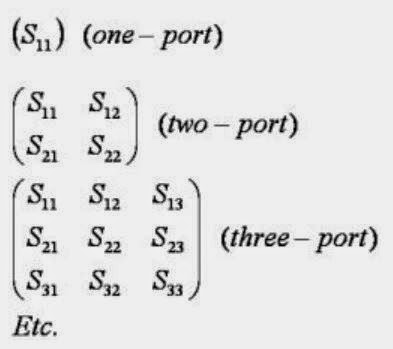
S-matrices for one-, two-, and three-port RF networks
Figure 1: S-matrices for one-, two-,
and three-port RF networks
Suppose you have an optical lens of some sort onto which you shine a light with a known photonic output. While most of the incident light passes through the lens, some fraction of the light is reflected and some is absorbed (the behavior is also dependent on the wavelength of the incident light). You'd like to characterize that lens: Exactly how much light was reflected? How much passed through? What is it about the lens that prevented all of the light from passing through?

16 April 2014

Is Your Testbench Mixed-Signal Ready?

A representative block diagram of a mixed-signal embedded system
Figure 1: A representative block diagram of
a mixed-signal embedded system
Mixed-signal design is ubiquitous these days, with hybrids of digital and analog circuitry turning up everywhere. A typical mixed-signal designer may be a hardware or software engineer with specific needs. They may be working with 4-bit, 8-bit, 16-bit, and 32-bit microcontrollers in a single embedded controller or across several embedded systems. They need to capture a host of different signal types and serial-data protocols and understand timing relationships between them. Then there's all the different sensor signals, power-supply signals, and PWM control signals to guarantee embedded system performance and reliability.

09 April 2014

Applying Multi-Stage, Multi-Rate Digital Filtering
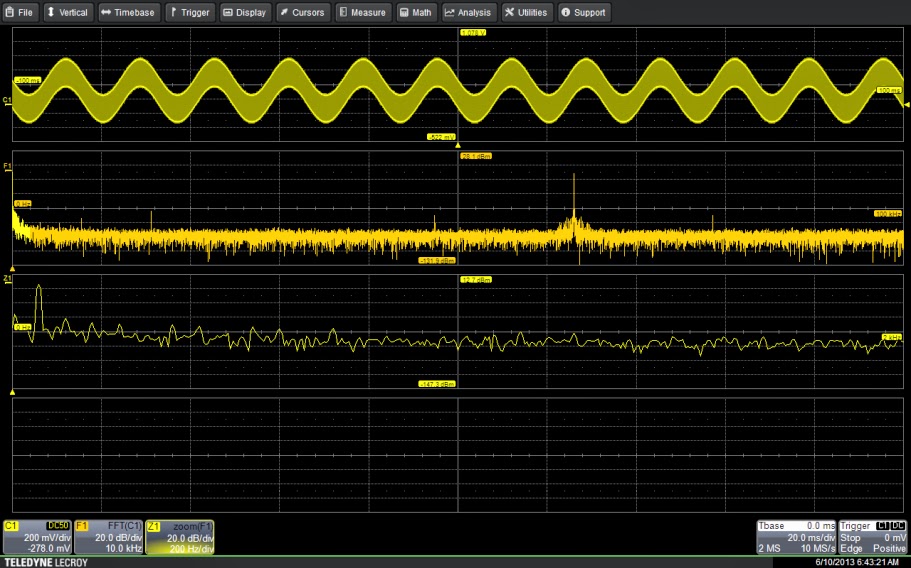
63-kHz signal with 60-Hz component
Figure 1: The input signal shows both the desired 63-kHz signal
along with a 60-Hz component. Zoom trace Z1 shows the
60-Hz component in detail.
A while back, we posted some basics on how to apply digital filters to sort out signals with undesirable elements riding on top of them, i.e. a square wave that's being corrupted by a sinusoidal signal creeping in from somewhere in your system design. Now, let's look at how to extend the range of cutoff frequencies for digital filters, allowing them to be used even more effectively.

02 April 2014

Understanding Probe Calibration Methods (Part II)

Experimental setup
Figure 1: Experimental setup for comparing a
source-referred signal to an unloaded signal
As many engineers and techs know, there's ample room for confusion when it comes to a proper understanding of oscilloscope probe loading. In an earlier post, we covered probe calibration methods and tried to sort out terms such as calibration, correction, compensation, and de-embedding.

26 March 2014

Using Digital Filters

Using a band stop filter
Figure 1: Using a band stop filter to remove a 5-MHz sine
wave from a 4-MHz square wave
In a perfect world, all of the signals we wish to view on our oscilloscopes would be as pure as the driven snow. However, in most scenarios, reality intervenes. As we know, everything in a system is an antenna, some being more efficient than others in terms of radiation and/or reception. Hey, crosstalk happens, and if you've got a sine wave and a square wave co-existing in the same general vicinity, it could make a true evaluation of the square wave difficult to do. But how do we get that nasty sine wave coming from one circuit to stop jumping on the  back of the square wave in another?

19 March 2014

Tips and Tricks: Rescaling for Non-Voltage Measurements

Using rescale to read a current probe's output in Amps
Figure 1: Using math rescale to read a current probe's
output directly in Amperes
As we know, an oscilloscope is essentially an instrument that measures a constantly varying voltage as a function of time. Those measurements are subsequently analyzed to derive other properties of the input signal, such as frequency, amplitude, rise/fall times, and so on. But what about measurements of other electrical quantities as a function of time?

12 March 2014

Use Trend Functions To Take Power's Pulse

When troubleshooting or debugging almost anything, the first step is usually to check what's going into the device or circuit and what's coming out on the other side. So it is with power supplies, which leads us to power line monitoring and trend functions.

05 March 2014

Measuring Time-Interval Error in Serial Data Waveforms

Measured times of arrival
Figure 1: The first step in quantifying jitter is to
determine measured times of arrival for bit transitions
A recent post covered some of the reasons why one might want to measure jitter. In design and debug of serial-data channels, jitter is among the most prevalent causes of unacceptable bit-error rates (BERs). In that earlier post, we looked at the physical phenomenon of jitter and why it wreaks the havoc that it does. In the present installment, we will look in broad terms at how jitter is measured and quantified.

26 February 2014

Understanding Probe Calibration Methods

If there's a topic concerning probes that causes confusion, questions, and misunderstandings, it's loading. It would be a much simpler world if attaching a probe to a circuit under test had no effect on either the signal being measured or the device the probe is connected to. Unfortunately, the world isn't quite so simple.

19 February 2014

Making Sense of Probe Terminology


As oscilloscope users, we know that the probe is a critical element in getting signals from the device under test into the instrument. The ideal probe would have perfectly flat magnitude response and perfectly linear phase response across its entire frequency range. Unfortunately, that probe, though striven for by all oscilloscope manufacturers, does not exist.

05 February 2014

Why Should You Measure Jitter?

Typical channel with jitter sources
Figure 1: Designing a serial-data channel with first-pass
success means analysis and mitigation of jitter sources
As mentioned in an earlier post on some basics of jitter, the bane of serial-link design is a signal that doesn't arrive at its destination when it should, whether early or late. The goal of serial-link design and implementation is to transmit data with as few bit errors as possible. Thus, analyzing jitter is a key element of achieving first-pass design success.

29 January 2014

Tips and Tricks: Stabilizing a Waveform Trace

One initial challenge to oscilloscope users is achieving a stable display of an input waveform. In almost all cases, the Auto Setup button on Teledyne LeCroy oscilloscopes (and most other modern instruments) will automatically set the oscilloscope's triggering system to get that jumpy trace to settle down.

22 January 2014

The Components of Total Jitter

Figure 1: An overview of the jitter hierarchy,
or "jitter tree," showing the various elements
that make up total jitter
In an earlier post, we began looking at the topic of jitter, a topic of keen interest to anyone working with high-speed serial communications or the components of such a system, including transmitters, receivers, and data channels. To gain an understanding of jitter, an important first step is getting to know a little about the various categories that comprise total jitter.

16 January 2014

Mr. Oscilloscope, Meet Mr. Computer

Figure 1: WaveStation software enables full remote
control of an oscilloscope from a Windows PC
Some things just seem made to go together, such as peanut butter and jelly, baseball and hot dogs, and Lennon and McCartney. But in the engineering world, one great combination is the oscilloscope and the PC. Both are wonderful tools but together they go places that neither can without the other.

08 January 2014

Let's Get Serial: About Manchester Data Encoding

Manchester coding example
Figure 1: An example of Manchester coding
Founded by the Roman Empire in the first century AD, the city of Manchester, England is probably best associated today with the Manchester United Football Club of neighboring Old Trafford. But in serial-data circles, the city's name evokes Manchester line coding, or phase encoding.