
 |
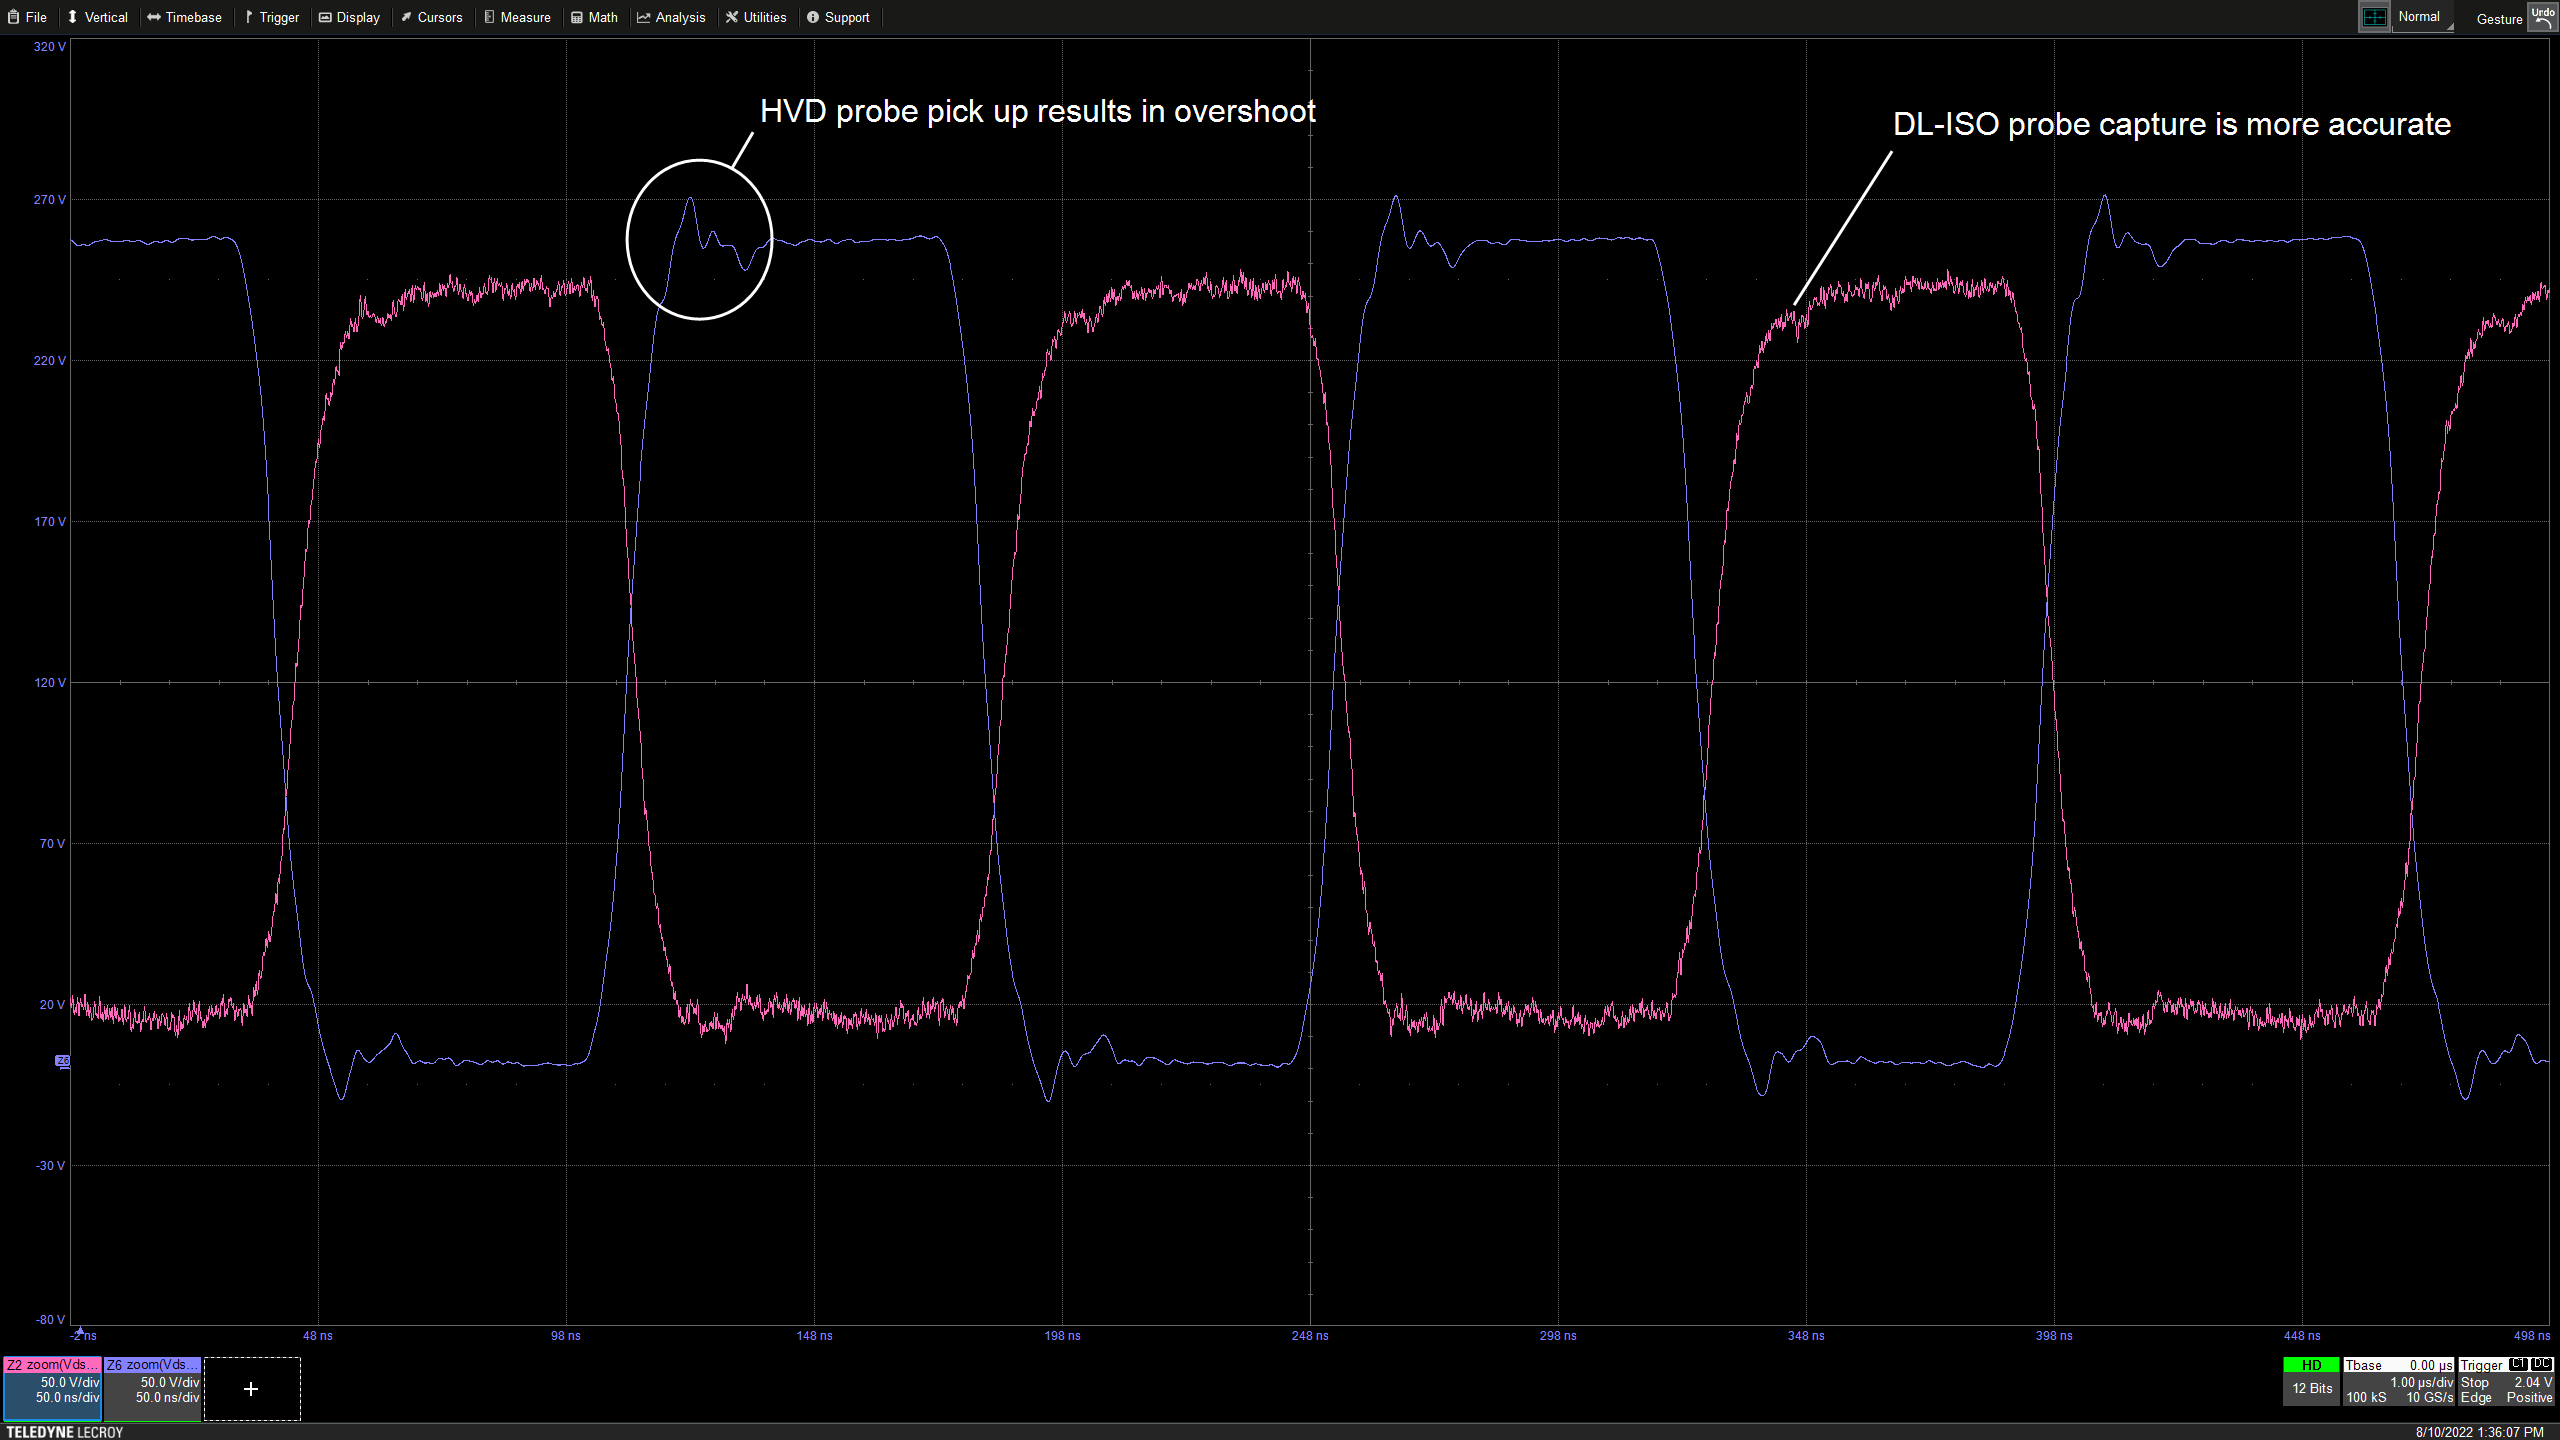
| Figure 1: Wide-bandgap (GaN) power semiconductor device waveforms captured using two, different probe topologies. Click on any image to expand. |
Why are power semiconductor device measurements challenging?
|
| Figure 1: Wide-bandgap (GaN) power semiconductor device waveforms captured using two, different probe topologies. Click on any image to expand. |
Why are power semiconductor device measurements challenging?

 |
| Figure 1: The High-voltage Probe Selection Guide color codes better or worse probe selections based on your answers to three, simple questions. Click any image to enlarge. |
Teledyne LeCroy offers this new, easy way to help you select a high-voltage oscilloscope probe based on your specific application—the High-voltage Probe Selection Guide—available on the Teledyne LeCroy website at: teledynelecroy.com/powerprobes
 |
| Figure 1: With unequal impedances at either end of the coax, are cable reflections a concern in 10x passive probes? |
 |
| Figure 1: The 10x passive probe becomes a better measurement tool when we understand its limitations |
 |
| Figure 1: Noise comparison of a Teledyne LeCroy D1605 probe and a competing model |
 |
| Figure 1: Differential-mode dynamic range is the maximum allowable voltage between the probe amplifier's inputs |
 |
| Figure 1: A probe's impedance varies with frequency |
 |
| Figure 1: Probes are the signal's gateway to the oscilloscope |