You need to test, we're here to help.

You need to test, we're here to help.
Showing posts with label Spectrogram. Show all posts

18 July 2022

Six Principles of FFT Analysis Using Real-time Oscilloscopes

Figure 1. A 100 MHz sine wave in the time domain and its spectrum in the frequency domain showing the one peak at 100 MHz.
Figure 1. A 100 MHz sine wave in the time domain
and its spectrum in the frequency domain showing
the one peak at 100 MHz. Click on any image to enlarge.
By Prof. Eric Bogatin,
Teledyne LeCroy Fellow

The following piece was published in Signal Integrity Journal and is excerpted here by permission of Signal Integrity Journal.

***************************

We live in the time domain. This is where we measure all digital performance. But sometimes, we can get to an answer faster by taking a detour through the frequency domain. With these six principles, we can understand how an oscilloscope transforms time domain measurements into a frequency domain view. All six principles are applied “under the hood” by oscilloscopes with a built-in FFT function. (Our note: Also by software packages designed for spectral analysis, such as the SPECTRUM-1 and SPECTRUM-PRO-2R options.)

1. The spectrum is a combination of sine wave components

In the frequency domain, the only waveforms we are allowed to consider are sine waves. There are other special waveforms combinations of which can describe any time-domain waveform, such as Legendre polynomials, Hermite polynomials or even wavelets. The reason we single out sine waves for a frequency domain description, is that sine waves are solutions to second order, linear, differential equations—the equations found so often in electrical circuits involving resistor, capacitor and inductor elements. This means signals that arise or have interacted with RLC circuits are described more simply when using combinations of sine waves than any other function because sine waves naturally occur. 

08 February 2021

Using Spectrograms to Visualize Spectral Changes

Figure 1. The spectrogram shows a history of change in a spectrum and highlights variations in frequency or amplitude.
Figure 1. The spectrogram shows a history of
change in a spectrum and highlights variations
in frequency or amplitude.

In our last post, we discussed spectral analysis of RF in the lab as part of developing situational awareness. Another tool for spectral analysis is the spectrogram.

The spectrogram is a display composed of the most recently acquired 256 spectra all stacked in a persistence display. It is a feature of the SPECTRUM-1 and SPECTRUM-PRO-2R options that highlights variations in acquired spectra, making dynamic changes immediately visible. 

The spectrogram in Figure 1 shows the timing dynamics of a power rail load variation in a three-dimensional (3D) plot with color persistence. The same data could also be rendered in a flat, two-dimensional (2D) spectrogram display, or using monochrome instead of color persistence.  

30 April 2018

Investigating IoT Wireless Signals (Part II)

This screen capture depicts frequency demodulation and subsequent Manchester decoding of the bit stream
Figure 1: This screen capture depicts frequency demodulation
and subsequent Manchester decoding of the bit stream
Internet of Things (IoT) devices must communicate with their peers--other IoT devices--as well as with the host system that governs their activities. In our previous post, we examined how to perform amplitude and frequency demodulation of RF bursts, such as Bluetooth Low Energy (BLE) advertising bursts. We'll continue with other methods of analyzing RF signals.

16 October 2013

Going From FFTs to Spectrum Analysis

Spectrum Analyzer software for the HDO series oscilloscopes provides an intuitive user interface
Figure 1: Spectrum Analyzer software for the HDO series
oscilloscopes provides an intuitive user interface
In earlier posts, we looked at a) the basics of fast-Fourier transforms (FFTs) and b) how to set up an FFT on a modern digital oscilloscope. In this post, we'll take a brief look at what that modern scope can do with an FFT, provided that scope is outfitted with software that will let it take full advantage. After all, the object of an FFT is to transform a time-domain waveform into the frequency domain. Sounds kind of like a spectrum analyzer, no?

15 March 2013

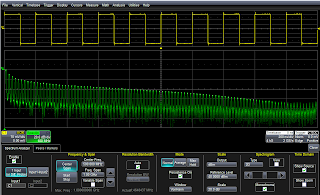
Spectrogram Display Is Another Tool in the SI Shed

An oscilloscope with spectrum-analysis capability marries the best that both instruments offer in one package. You get the traditional oscilloscope view of signals in the time domain, but you also get the spectrum analyzer’s ability to take the same signal and look at it from the frequency perspective.