
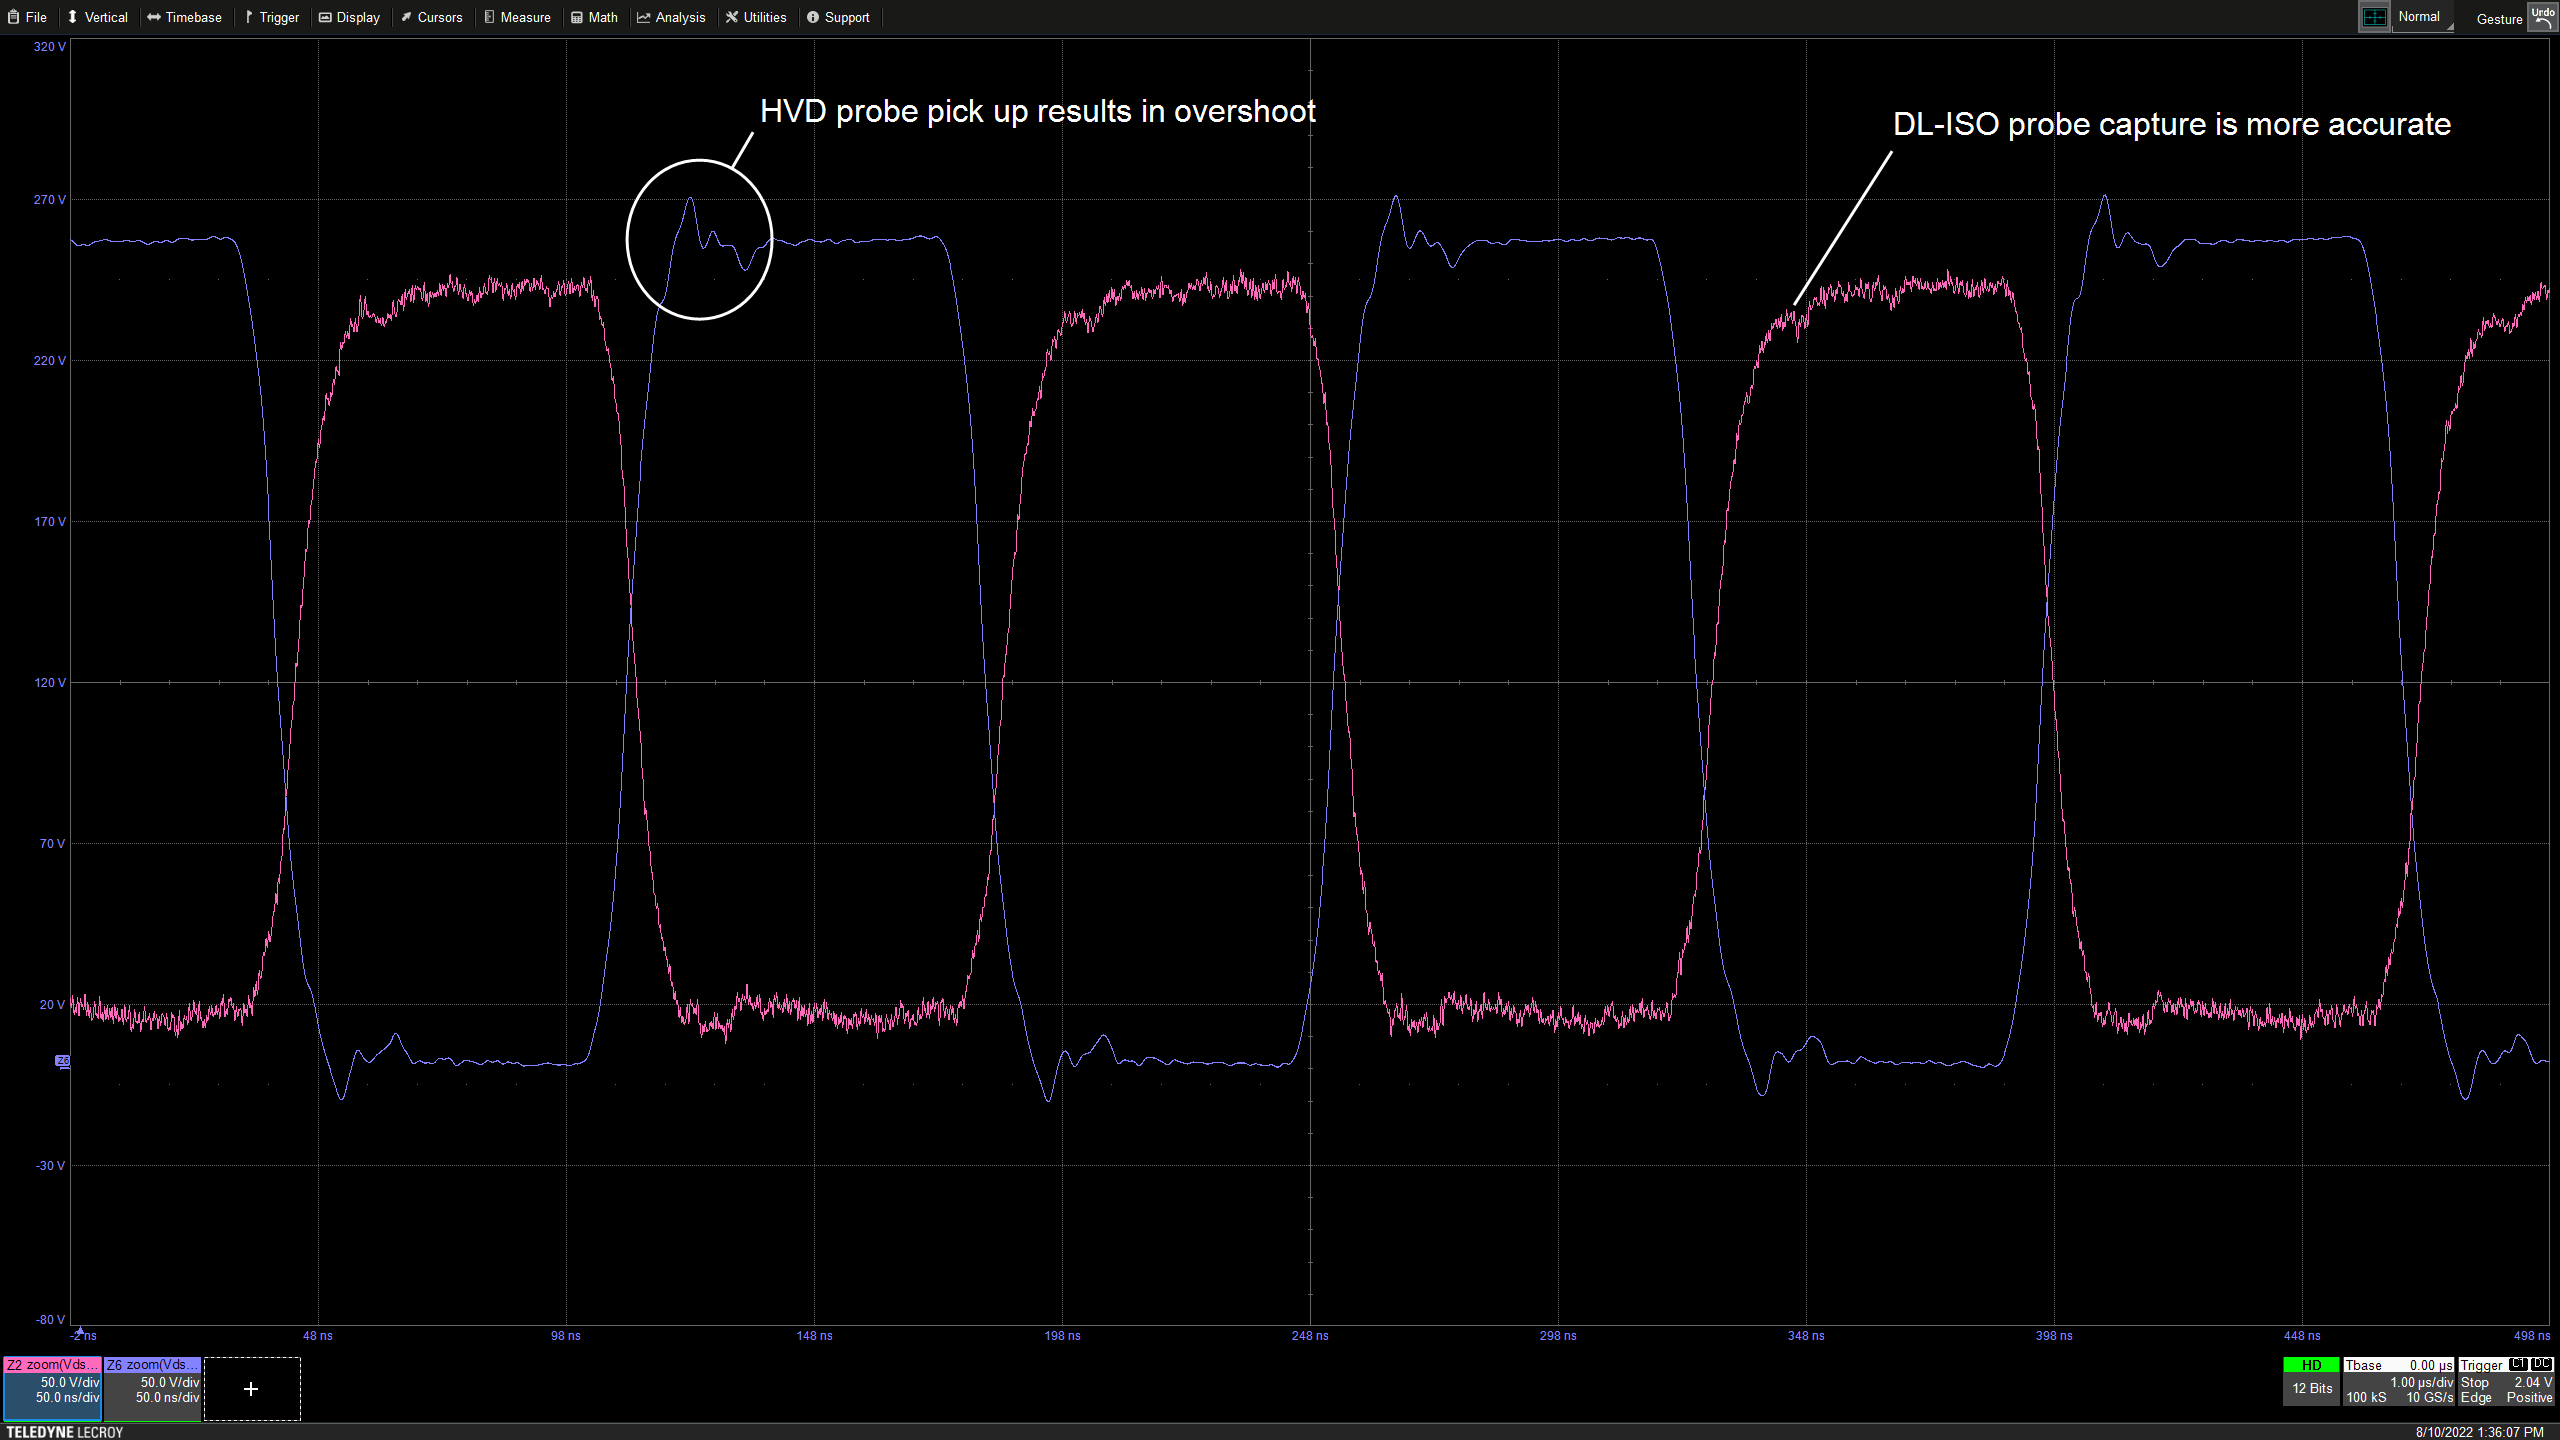
 |
| Figure 1: Wide-bandgap (GaN) power semiconductor device waveforms captured using two, different probe topologies. Click on any image to expand. |
Why are power semiconductor device measurements challenging?
|
| Figure 1: Wide-bandgap (GaN) power semiconductor device waveforms captured using two, different probe topologies. Click on any image to expand. |
Why are power semiconductor device measurements challenging?

 |
| Figure 1: The High-voltage Probe Selection Guide color codes better or worse probe selections based on your answers to three, simple questions. Click any image to enlarge. |
Teledyne LeCroy offers this new, easy way to help you select a high-voltage oscilloscope probe based on your specific application—the High-voltage Probe Selection Guide—available on the Teledyne LeCroy website at: teledynelecroy.com/powerprobes
 |
| Figure 1: Reversed Handsfree mounts and chip clips help relieve strain on fragile solders. |
The Handsfree probe holder included as an accessory with several Teledyne LeCroy probes, such as the WaveLink and DH Series probes, was originally designed to put weight on the probe tip to ensure a good contact. However, many DDR probing applications utilize solder-in (SI) tips, where the greater concern is to relieve strain on the tip so as to not disrupt the solder. It turns out that if you use the Handsfree in a “reverse mounted” orientation (Figure 1), it puts the amplifier in a perfect position to help relieve strain on probe tips.
 |
| Figure 1: CMRR plots for two attenuation settings of an HVD3106A differential probe. |
Although CMRR as a function of frequency is a principal specification for differential probes, manufacturer's CMRR plots are the result of testing with a narrowband source under strictly controlled laboratory conditions. In real-world applications of probes to broadband sources, you can expect a different result. This quick test will inform you how different.
 |
| Figure 1: The basic building blocks of power conversion circuits are the power MOSFET and the IGBT; shown are (left) an N-channel enhancement-mode MOSFET and (right) a P-channel (minority carrier) IGBT |
 |
| Figure 1: Probe, cable, and oscilloscope form a system that makes or breaks the accuracy of signal acquisitions |
 |
| Figure 1: The typical manner of using a hands-free probe holder can cause issues |
 |
| Figure 1: Noise comparison of a Teledyne LeCroy D1605 probe and a competing model |
 |
| Figure 1: Input offset range is how much differential offset a probe can apply to an input signal to bring it within its differential-mode output range |
 |
| Figure 1: Differential-mode dynamic range is the maximum allowable voltage between the probe amplifier's inputs |
 |
| Figure 1: Applying bandwidth filters to a 2.5-GHz clock signal clearly shows the effect of bandwidth on rise time |
 |
| Figure 1: An example of differential probes measuring from test point to test point. |
 |
| Figure 1: Active oscilloscope probes sport high resistance and low capacitance at their tips, but terminate into a scope's 50Ω input. |
 |
Figure 1: An example of an active
oscilloscope probe
|
 |
| Figure 1: Emitter voltage measurement in simplified schematic view |