
 |
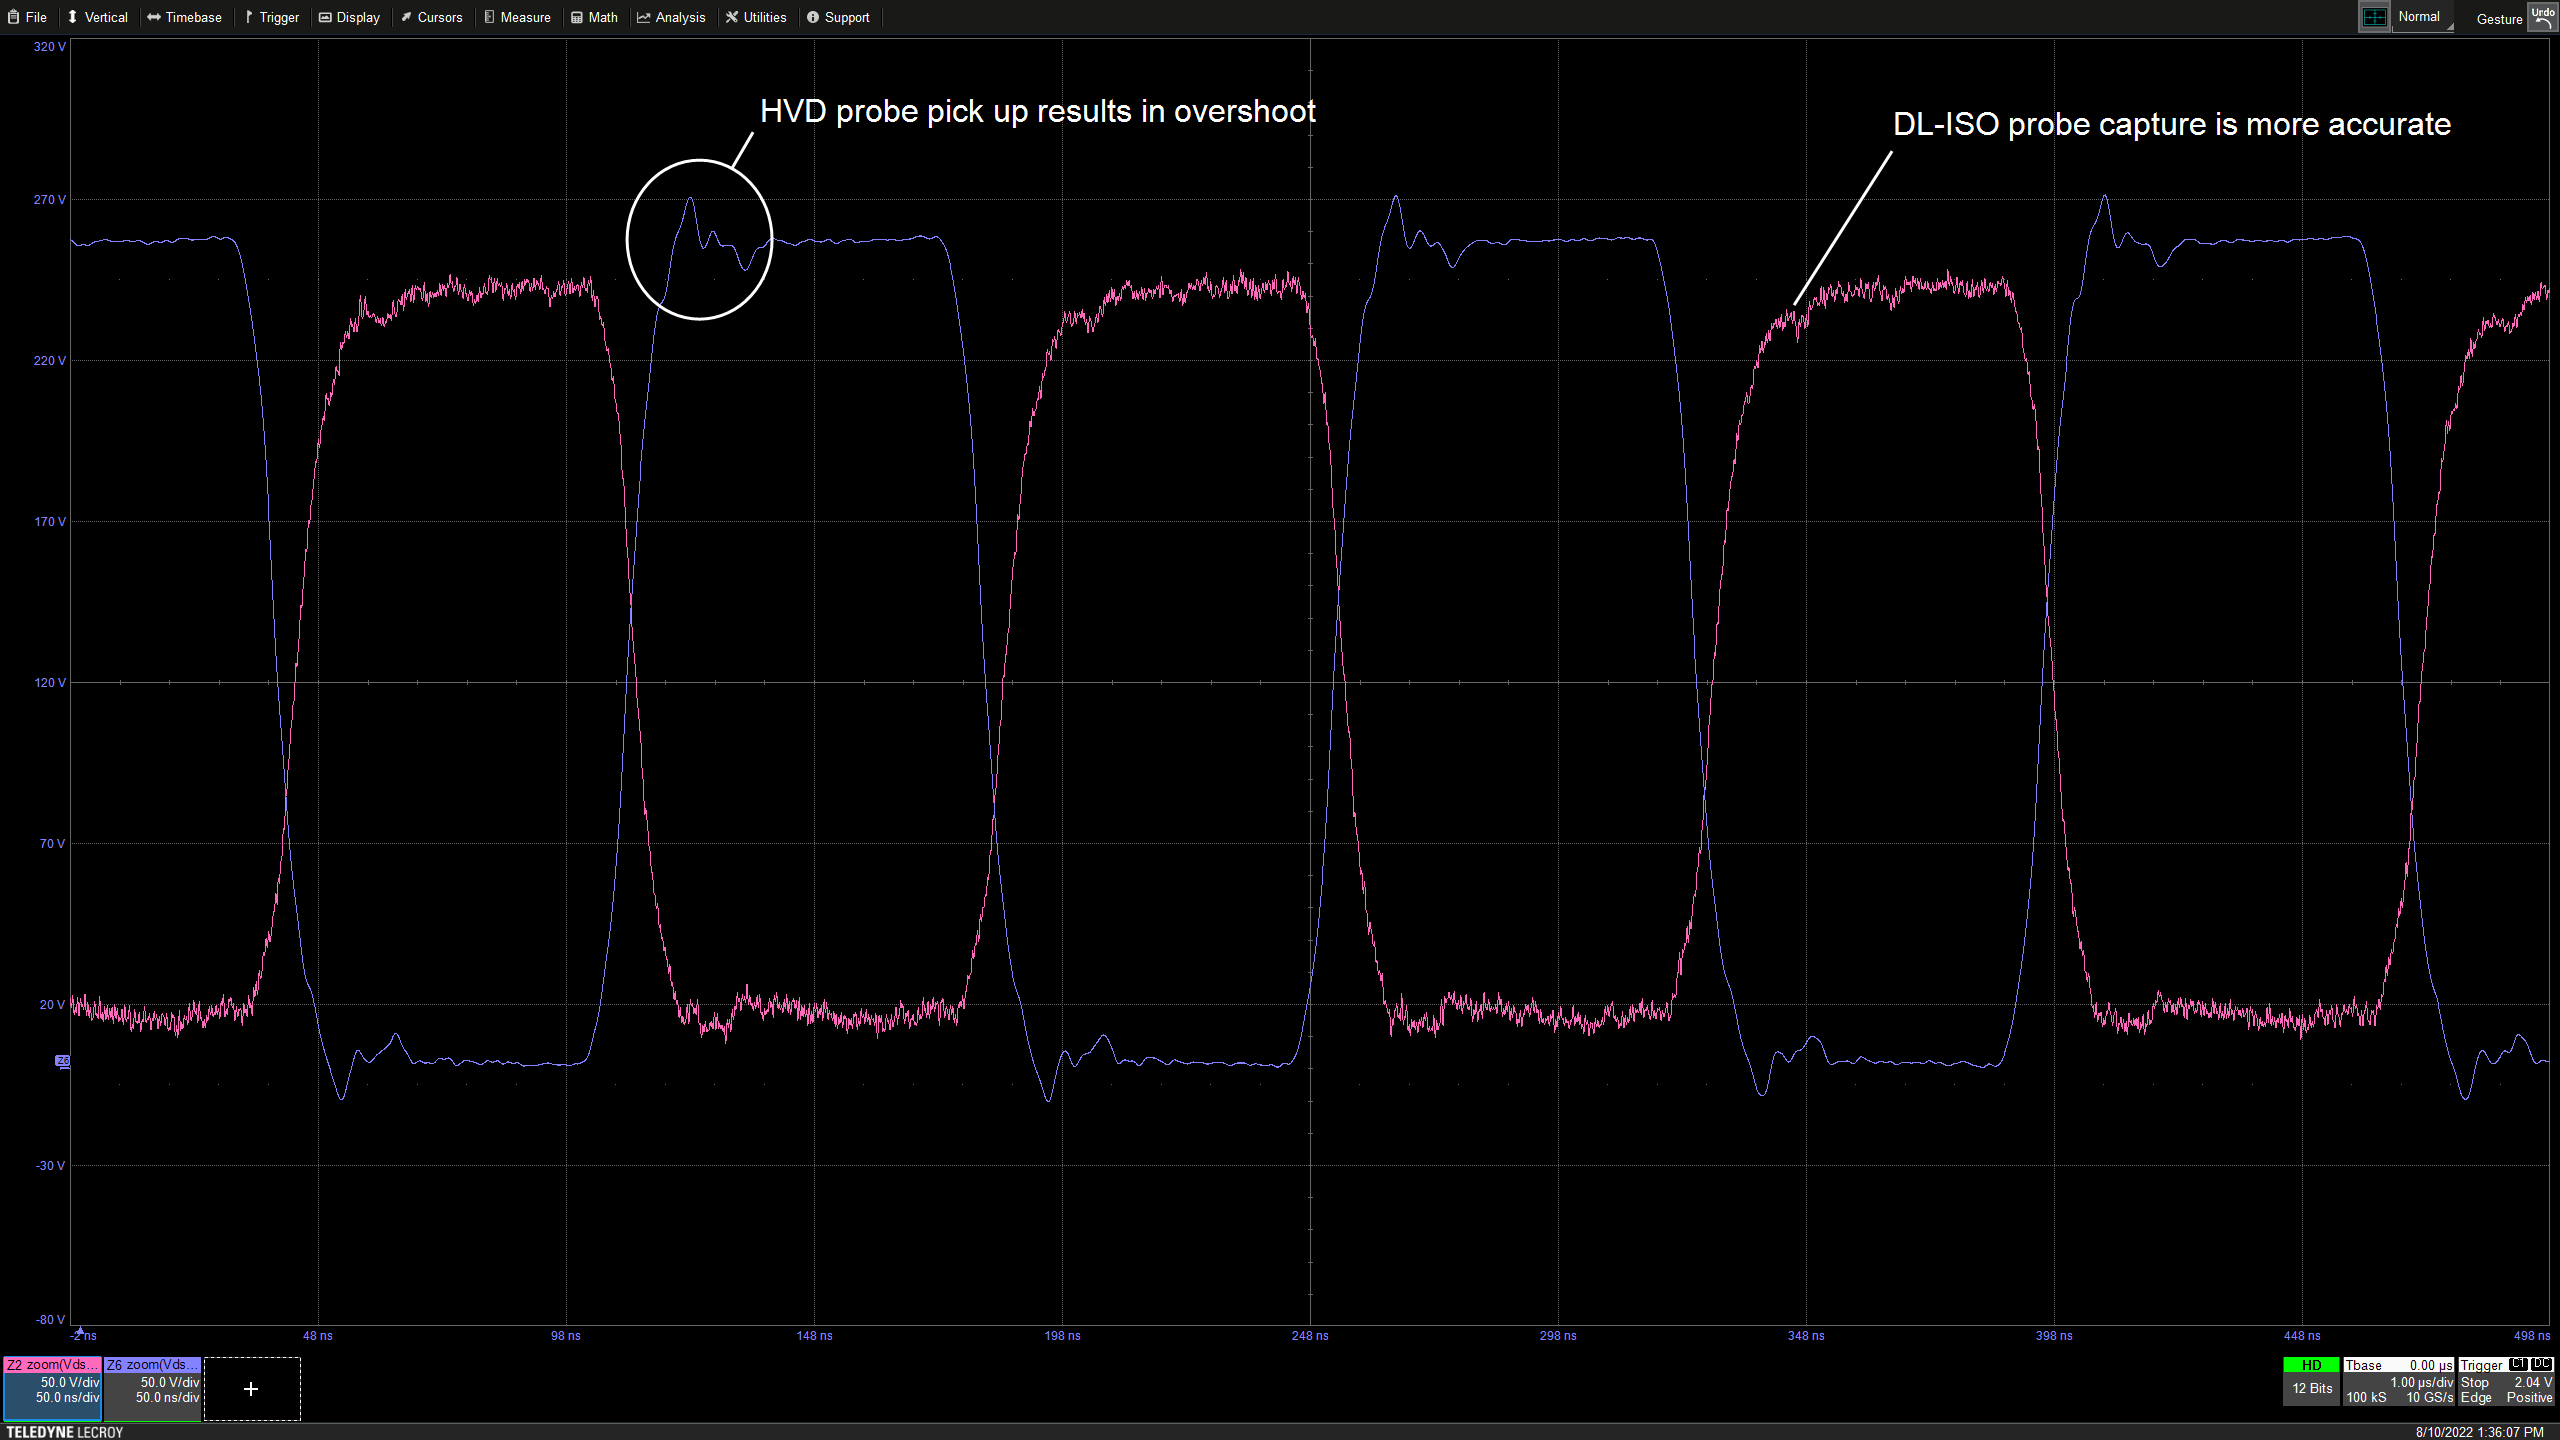
| Figure 1: Wide-bandgap (GaN) power semiconductor device waveforms captured using two, different probe topologies. Click on any image to expand. |
Why are power semiconductor device measurements challenging?
|
| Figure 1: Wide-bandgap (GaN) power semiconductor device waveforms captured using two, different probe topologies. Click on any image to expand. |
Why are power semiconductor device measurements challenging?

 |
| Figure 1: The High-voltage Probe Selection Guide color codes better or worse probe selections based on your answers to three, simple questions. Click any image to enlarge. |
Teledyne LeCroy offers this new, easy way to help you select a high-voltage oscilloscope probe based on your specific application—the High-voltage Probe Selection Guide—available on the Teledyne LeCroy website at: teledynelecroy.com/powerprobes
 |
| Figure 1: The typical manner of using a hands-free probe holder can cause issues |
 |
| Figure 1: For compliance testing, DDR transition density should be as high as possible |
 |
| Figure 1: DDR test configuration for a desktop computer |