You need to test, we're here to help.

You need to test, we're here to help.
Showing posts with label jitter histogram. Show all posts

28 February 2022

Signal and Power Integrity Tutorial: A Robust Method for Measuring Clock Jitter with Oscilloscopes

Figure 1. Clock jitter measured as a variation of clock signal absolute period.
Figure 1. Clock jitter measured as a variation
of clock signal absolute period.
Clock jitter is the variation of a clock signal’s frequency or period. Either measurement carries the same information, but the period measurement is a simple time interval measurement easily performed using a real-time oscilloscope. If we have a robust way of measuring clock jitter, we have the basis for measuring the clock signal’s sensitivity to other features in the environment that can affect the period. Voltage noise on the power rail is just one external force that can affect clock jitter, which we'll show you how to measure in a future post.

In this post, we’ll demonstrate a robust method for measuring clock jitter using an example from Dr. Eric Bogatin’s webinar, “The Impact of Power Rail Noise on Clock Jitter.”  

The clock in our examples is a 5-stage ring oscillator which generates a square wave signal between 10 and 66 MHz. The test instrument is a WavePro HD 12-bit, 4-Ch, 8 GHz, 20 GS/s, 5 Gpts oscilloscope with 60 fs sample clock jitter.

In the process, we make a series of oscilloscope sample clock tests and timebase adjustments as  consistency checks. While measuring jitter is less about absolute accuracy than about the relative precision of measuring the time interval from cycle to cycle, a fundamental part of that is ensuring the absolute accuracy of the oscilloscope’s timebase.

12 March 2015

The History of Jitter (Part II)

An example of using histograms to plot the statistical distribution of edge arrival times
Figure 1: An example of using histograms to plot
the statistical distribution of edge arrival times
Resuming our review of the history of jitter and the evolving response to it, we'd arrived at the late 1990s, when more sophisticated analysis methods were necessary to get a good handle on jitter. In particular, statistical analysis came onto the scene. Statistics are a great tool for analyzing phenomena such as jitter that change more as you look at them harder.

05 March 2014

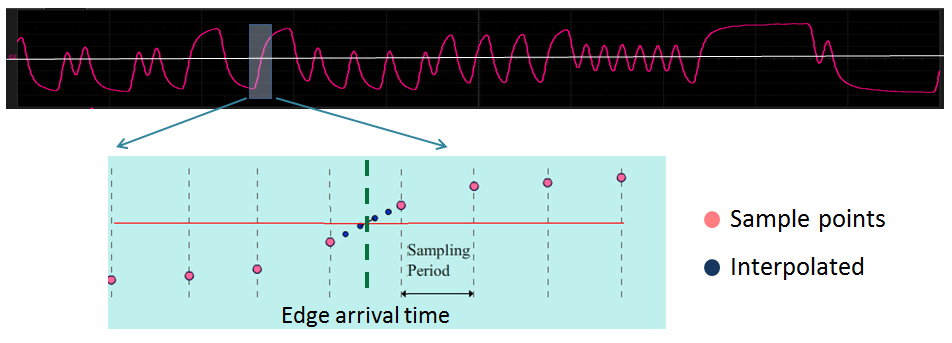
Measuring Time-Interval Error in Serial Data Waveforms

Measured times of arrival
Figure 1: The first step in quantifying jitter is to
determine measured times of arrival for bit transitions
A recent post covered some of the reasons why one might want to measure jitter. In design and debug of serial-data channels, jitter is among the most prevalent causes of unacceptable bit-error rates (BERs). In that earlier post, we looked at the physical phenomenon of jitter and why it wreaks the havoc that it does. In the present installment, we will look in broad terms at how jitter is measured and quantified.