You need to test, we're here to help.

You need to test, we're here to help.
Showing posts with label eye diagram. Show all posts

14 November 2022

SDAIII and QualiPHY Software: Oscilloscope Eye Diagrams for Compliance and Debug

Figure 1. SDAIII enables eye diagrams and eye measurements of four lanes of  streaming data.
Figure 1. SDAIII enables eye diagrams and eye
measurements of four lanes of  streaming data.
Besides the serial TDME and TDMP options discussed earlier, there are other ways to generate eye diagrams on your Teledyne LeCroy oscilloscope for compliance testing and debug.

SDAIII Serial Data Analysis Software

SDAIII offers the most comprehensive eye diagram capabilities for Teledyne LeCroy oscilloscopes, with tools for optimizing the displayed eye that are especially useful to high-speed serial data analysis.

11 November 2022

Serial Trigger, Decode, Measure/Graph & Eye Diagram (TDME) Software: Oscilloscope Eye Diagrams for Debug

Eye diagrams generated from two serial decodes.
Figure 1. Two eye diagrams generated from 
three active USB serial decoders.
Click any image to enlarge it.

The eye diagram is a general-purpose tool for analyzing the signal integrity of serial digital communications signals. It shows the effects of additive vertical noise, horizontal jitter, duty cycle distortion, inter-symbol interference, and crosstalk on a serial data stream. The vertical opening of the eye is affected by these elements, as well as gain differences between devices on the bus, so that the more problems with signal integrity, the more “sleepy” the eye appears. A wide open eye is indicative of good signal integrity.

It is commonplace to use an oscilloscope with decoder software to analyze the health of serial data streams, where the combination of the electrical waveform and the link layer decoding shows if and where the protocol breaks down at the physical layer, but an eye diagram can better show the degree of signal interference that may be impacting the serial logic—especially if it could be generated for particular devices or packets.

10 October 2022

Oscilloscope Testing of 10Base-T1S Automotive Ethernet Signal Integrity

Eye diagram generated from decoded 10Base-T1S signal
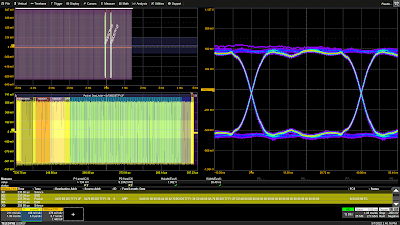
Figure 1. The 10Base-T1S TDME option features
easy eye diagram creation for signal integrity analysis.
Click on any image to enlarge it.
In addition to special serial data bus measurements of 10Base-T1S signals, the 10Base-T1S Trigger, Decode, Measure/Graph & Eye Diagram (TDME) option automates the generation and display of eye diagrams on Teledyne LeCroy oscilloscopes. Eye diagrams are an important element of serial data analysis, used to understand the signal integrity of the communications network. 

The eye diagram is a general-purpose tool for analyzing serial digital communications signals. It shows the effects of additive vertical noise, horizontal jitter, duty cycle distortion, inter-symbol interference, and crosstalk on a serial data stream. 

The eye diagram is formed by overlaying repetitive occurrences of slightly more than a single clock period (UI) of a serial data signal on a persistence display which shows the accumulated history of multiple acquisitions, as shown in Figure 1.

Due to the use of Differential Manchester encoding (DME), the 10Base-T1S eye is formed with twice the signal clock rate. The signal shown has a symbol rate of 12.5 Mbps and the eye is clocked at 25 Mbps. 

29 June 2018

The Effects of De-Emphasis on Eye Diagrams

This "at the receiver" eye diagram of a serial-data stream shows the effect a lossy channel has on signal quality
Figure 1: This eye diagram of a serial-data stream as measured
at the receiver shows the effect a lossy channel has
on signal quality
Having discussed what transmit pre-emphasis is all about and the various ways in which it's implemented, it might be useful at this juncture to look at some examples of its application and the salutary effect it can have on the signal's eye diagram at the receiver end of the channel. Recall that there are two variations on pre-emphasis: de-emphasis and pre-shoot, which use different taps of a three-tap finite impulse response (FIR) filter to emphasize the last bit or the first bit of a bit sequence, respectively.

12 June 2018

How Much Transmission-Line Loss is Too Much?

This plot represents the differential insertion-loss profile for a 20" FR-4 microstrip trace
Figure 1: This plot represents the differential insertion-loss
profile for a 20" FR-4 microstrip trace
One of the fundamental facts of transmission lines is losses. Any effort to debug the performance of a high-speed serial data link begins there. But it begs an equally fundamental question: How much loss in a transmission line is too much? How do we quantify losses, and what is the connection between attenuation at the Nyquist frequency and the eye diagram? Is there a rule of thumb one might apply, some sort of rough estimate of how much loss might be too much for your channel to bear at a given data rate?

06 June 2018

A Look at Transmission-Line Losses

Using a 3D field solver to simulate a differential trace
Figure 1: Using a 3D
field solver to simulate
a differential trace
In surveying the subject of debugging high-speed serial data links, we've noted that there's no one cause for signal-integrity issues between transmitter and receiver, and there's certainly no one solution. But let's begin with the low-hanging fruit: electrical losses in the transmission line. We've previously done a series of posts on transmission lines (beginning here), but it's worth it to have a quick refresher.

05 June 2018

Introduction to Debugging High-Speed Serial Links

These images depict the degradation of serial data traffic as it makes its way from transmitter to receiver
Figure 1: These images depict the degradation of serial data
traffic as it makes its way from transmitter to receiver
In recent years, the data rates in serial links have increased exponentially across any number of standard protocols, including PCI Express, USB, and even SATA and SAS. With higher data rates comes more challenges for system designers, validation engineers, and test engineers with respect to signal integrity (SI). Some SI effects are much more prominent at higher data rates than they were for lower-speed versions of the same protocols. In this series of posts, we'll examine these SI effects, look at some methods of improving system performance, and discuss some SI analysis solutions as well as measurement considerations.

18 May 2018

Examples of IoT DDR Debug Scenarios

Using the oscilloscope's Track math function can help pin down timing anomalies
Figure 1: Using the oscilloscope's Track
math function can help pin down
timing anomalies
Our last post considered some broad aspects of debugging DDR memory on Internet of Things (IoT) devices, such as how chip interposers can help with probing access and the benefits of virtual probing software. Let's now take a look at some particular examples of problems with these memory chips and their controllers and see how debugging with an oscilloscope might be approached.

05 February 2018

Getting The Most Out Of Your Oscilloscope: Physical-Layer Tools

Trigger dialog boxes will match the protocol of interest
Figure 1: Trigger dialog boxes will
match the protocol of interest
Debugging and validation of the physical layer of serial-data links is a preeminent oscilloscope application area these days. Today's real-time digital oscilloscopes have a wealth of tools to help you dig into any/all serial protocols and learn what's really going on electrically with your serial links.

15 January 2018

PCIe 4.0 Receiver Link-Equalization Testing (Part II)

Working out the optimal combination of Tx emphasis presets and receiver CTLE settings
Figure 1: Working out the optimal combination of Tx emphasis
presets and receiver CTLE settings
As may be apparent from our previous post on PCIe 4.0 receiver link-equalization testing, this part of the PCIe 4.0 compliance tests is somewhat involved. When we left off last time, we were in the midst of receiver calibration, looking to ensure that the test-signal eye is as closed as possible without violating the specification limits.

PCIe 4.0 Receiver Link-Equalization Testing (Part I)

PCIe 4.0 receiver link-equalization testing takes place at the site of the channel's worst-case signal
Figure 1: PCIe 4.0 receiver link-equalization testing
takes place at the site of the channel's worst-case signal
In the battery of PCIe 4.0 compliance tests, there is but a single test of receiver behavior: Rx link-equalization testing. Given that our DUT in this test is an add-in card, we want to have our worst-case signal at the Card ElectroMechanical (CEM) connector (Figure 1). The signal then proceeds through the channel on the add-in card to the end point, which is the receiver on the DUT.

20 July 2017

The Periodic Table of Oscilloscope Tools: Analyze (Part II)

The Analysis tools in an oscilloscope lend it debug power
Figure 1: The Analysis
tools in an oscilloscope
lend it debug power
Oscilloscopes are central to many engineering tasks, but perhaps to none more so than debugging. Something is going on with your design but you don't know what it is. However, armed with an oscilloscope with the sort of sophisticated analysis tools found in Teledyne LeCroy's instruments, even Mr. Jones can get to the bottom of the problem. Let's continue our survey of the Periodic Table of Oscilloscope Tools with more on analysis tools.

15 July 2015

The Fundamentals of PAM4

PAM4 doubles the number of bits in serial data transmissions by increasing the number of levels of pulse-amplitude modulation, but does so at the cost of noise susceptibility
PAM4 doubles the number of bits in serial data transmissions
by increasing the number of levels of pulse-amplitude modulation,
but does so at the cost of noise susceptibility
As our society's hunger for data grows—not only more data, but more data delivered faster—older modulation schemes based on NRZ-type encoding grow increasingly inadequate. We need to get data from point A to point B as efficiently as possible, whether that means between chips on a PC board or from one end of a long-haul optical fiber to the other. A modulation scheme that's gaining favor in many quarters is PAM4, and in this post we'll look at the basics of PAM4 before turning to the test and analysis challenges it poses.

02 April 2015

The History of Jitter (Part III)

Latching a signal at the outermost of the blue hash marks results in a BER of 10-3, while latching it at the innermost hash marks yields a BER of 10-12
Figure 1: Latching a signal at the outermost of the blue
hash marks results in a BER of 10-3, while latching it
at the innermost hash marks yields a BER of 10-12
If you've been keeping track of our history of jitter, we left off in Part II in the late 1990s, by which time bit-error rates (BER) had become a predominant statistic for quantifying jitter. That was subsequently refined into thinking in terms of BER as a function of jitter.

26 January 2015

Plan For Successful USB Compliance Testing (Part II)

A representative transmitter compliance test setup
Figure 1: A representative transmitter
compliance test setup
In the first post in this series, we looked at some of the basics of USB 3.0 and 3.1 compliance test and covered the USB-IF's role in overseeing the protocol. Now, let's look into some aspects of physical-layer test.

10 November 2014

PCIe 3.0 Dynamic Link EQ: De-Emphasis, Preshoot, Cursors, and Presets

De-emphasis, a key transmit-side equalization technique for PCIe 3.0, boosts high-frequency content
Figure 1: De-emphasis, a key transmit-side equalization
technique for PCIe 3.0, boosts high-frequency content
In an earlier post, we looked at some of the basics of dynamic link equalization for PCIe 3.0, and in particular the reasons why it's not only necessary but mandated by the PCI-SIG for compliance testing. Essentially, the boost in data rates from 5 GT/s in PCIe 2.0 to 8 GT/s in PCIe 3.0 wreaked havoc in terms of signal integrity in the channel. The solution is found in equalization both before (TxEQ) and after (RxEQ) the channel.

06 November 2014

The Hows and Whys of PCIe 3.0 Dynamic Link Equalization

SI problems are the root cause for dynamic link equalization in PCIe 3.0
Figure 1: SI problems are the root cause for
dynamic link equalization in PCIe 3.0
If you're designing a computer peripheral these days, chances are that you'll use the Peripheral Component Interconnect Express (PCIe) protocol for communication between the device and the host system. With the emergence of PCIe, a bunch of older bus standards were kicked to the curb. PCIe itself became the basis for more specialized standards, most notably ExpressCard for laptop expansion cards and SATA Express for storage interfaces.