You need to test, we're here to help.

You need to test, we're here to help.

10 October 2022

Oscilloscope Testing of 10Base-T1S Automotive Ethernet Signal Integrity

Eye diagram generated from decoded 10Base-T1S signal
Figure 1. The 10Base-T1S TDME option features
easy eye diagram creation for signal integrity analysis.
Click on any image to enlarge it.
In addition to special serial data bus measurements of 10Base-T1S signals, the 10Base-T1S Trigger, Decode, Measure/Graph & Eye Diagram (TDME) option automates the generation and display of eye diagrams on Teledyne LeCroy oscilloscopes. Eye diagrams are an important element of serial data analysis, used to understand the signal integrity of the communications network. 

The eye diagram is a general-purpose tool for analyzing serial digital communications signals. It shows the effects of additive vertical noise, horizontal jitter, duty cycle distortion, inter-symbol interference, and crosstalk on a serial data stream. 

The eye diagram is formed by overlaying repetitive occurrences of slightly more than a single clock period (UI) of a serial data signal on a persistence display which shows the accumulated history of multiple acquisitions, as shown in Figure 1.

Due to the use of Differential Manchester encoding (DME), the 10Base-T1S eye is formed with twice the signal clock rate. The signal shown has a symbol rate of 12.5 Mbps and the eye is clocked at 25 Mbps. 
05 October 2022

Oscilloscope Measurements of 10Base-T1S Automotive Ethernet PLCA Cycle Timing

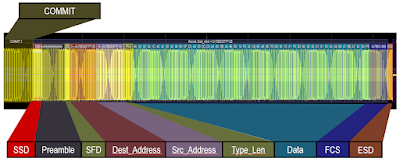
10Base-T1S frame with color-coded decoder overlay
Figure 1. Color-coded decoding of 10Base-T1S
stream makes it easy to measure timing between
signal elements. Click on any image to enlarge.
The 10Base-T1S Trigger-Decode (TD) and 10Base-T1S Trigger, Decode, Measure/Graph & Eye Diagram (TDME) options enable Teledyne LeCroy oscilloscope users to trigger on and decode Ethernet control and payload data from 10Base-T1S Automotive Ethernet signals. The decoding is color-coded to provide fast, intuitive understanding of the relationship between message frames and other time-synchronous events. Knowing the location of the various protocol elements makes it easy to measure Physical Layer Collision Avoidance (PLCA) cycle timing using either standard oscilloscope tools, or special serial bus measurements included with the TDME options.

PLCA cycle timing is measured to assure interoperability of the attached nodes in a 10Base-T1S mixed-segment, multidrop bus. This class of tests measures the timing between events on the bus relative to a specific bus event, usually the BEACON signal initiated by the Master node. 

Let’s look at a simple example of a 10Base-T1S network with two nodes, the Master (Node 0) and a device (Node 3). The acquired waveform is shown in Figure 2, decoded using the 10Base-T1S TDME option. The top grid shows the complete acquisition, which consists mostly of BEACON signals over a record of twenty-five million samples. Toward the end of the acquisition are two packets from the other nodes. The table at the bottom of the screen lists all the elements decoded in the full acquisition.