You need to test, we're here to help.

You need to test, we're here to help.
Showing posts with label power integrity. Show all posts

28 November 2022

New 60 V Offset Power Rail Probes Offer the Capability Needed for 48 V Power Integrity Analysis

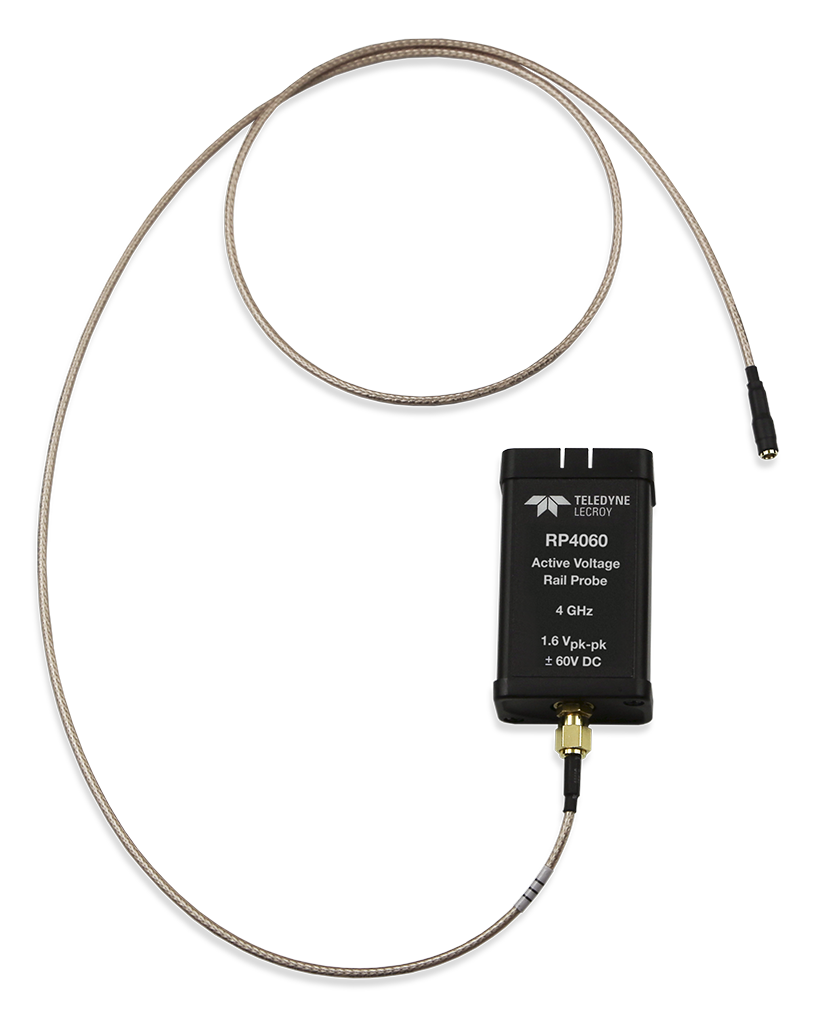
RP4060 Rail Probe
Figure 1. The RP2060 and RP4060
build on the legacy of the RP4030 power
rail probe. The new probes are ideally
suited to working with the new 48 Vdc 
power structures.
In 2016, Teledyne LeCroy first offered the RP4030 Power Rail Probe, which was designed to enable engineers to probe a low-impedance, low-voltage DC power/voltage rail signal without loading the device under test (DUT). It provided ±30 V of probe offset to allow a DC power/voltage rail signal to be displayed in the vertical center of the oscilloscope regardless of the gain (sensitivity) setting.

Recently, we released two, new power rail probes that build on those capabilities—the 2 GHz RP2060 and 4 GHz RP4060. Both probes feature:

  • ±60 V Offset Capability
  • ±800 mV Dynamic Range
  • 50 kΩ DC Input Impedance (for low loading of low-impedance power rails)
  • 1.2:1Attenuation (for low additive noise)
  • MCX-terminated cable with a variety of board connections: 4 GHz*-rated MCX PCB mount;
    4 GHz* solder-in; 3 GHz* coaxial cable to U.FL PCB mount; optional 500 MHz browser
* Bandwidths listed are for the 4 GHz RP4060. Maximum bandwidth when used with RP2060 is 2 GHz.

Why the New Probes?

One driver of the new release is the increase in the number and size of data centers needed to support cloud computing and other data-intensive applications, and the new power architectures they require. The new rail probe is designed to ideally meet the needs of engineers working with power rails rated up to 48 Vdc.

09 May 2022

Signal and Power Integrity Tutorial: Measuring Clock Jitter Sensitivity to Power Rail Noise, Pt. 2

Figure 1. 400 mVpp oscillation on the power trace is due to 48 MHz clock noise.
Figure 1. 400 mVpp oscillation on the power trace
is due to 48 MHz clock noise.

In Part 1, we used a function generator to create a power source with a known perturbation. Seeing that the noise on the power rail and the clock period were synchronous when we observed both traces together using a WavePro HD oscilloscope, we knew that there was a clear relationship between the two to be further investigated. Now, we're ready to examine more closely how the clock jitter responds to voltage variations on the power rail.

02 May 2022

Signal and Power Integrity Tutorial: Measuring Clock Jitter Sensitivity to Power Rail Noise, Part 1

Figure 1. Voltage variations on the power rail shown in the same grid as the clock period track (jitter track). These waveforms are the basis of the clock jitter sensitivity measurement. The inverse relationship between the jitter track and the power trace shows that the clock is sensitive to variations in rail voltage.
Figure 1. Voltage variations on the power rail
shown in the same grid as the clock period track
(jitter track). These waveforms are the basis of
the clock jitter sensitivity measurement. The
inverse relationship between the jitter track and
the power trace shows that the clock
is sensitive to variations in rail voltage.

In a previous post, we described A Robust Method for Measuring Clock Jitter with Oscilloscopes as variation in a clock signal’s period. Clock jitter is characterized by the standard deviation (sdev) of the clock period measurement. The track function of the clock period sdev shows us the variations in jitter over time, synchronous with the waveform source. 

In this post and the next, we’ll show how to make use of the clock period track function to match jitter variations to possible sources of jitter, in particular to voltage variations on the clock power rail. The offset voltage of a function generator powers a clock signal source. By creating a known variation in the function generator output, we can match that to the resulting clock jitter to calculate the clock jitter sensitivity to rail voltage changes. A known clock jitter sensitivity value can help you predict how a design will respond to rail voltage changes.

28 February 2022

Signal and Power Integrity Tutorial: A Robust Method for Measuring Clock Jitter with Oscilloscopes

Figure 1. Clock jitter measured as a variation of clock signal absolute period.
Figure 1. Clock jitter measured as a variation
of clock signal absolute period.
Clock jitter is the variation of a clock signal’s frequency or period. Either measurement carries the same information, but the period measurement is a simple time interval measurement easily performed using a real-time oscilloscope. If we have a robust way of measuring clock jitter, we have the basis for measuring the clock signal’s sensitivity to other features in the environment that can affect the period. Voltage noise on the power rail is just one external force that can affect clock jitter, which we'll show you how to measure in a future post.

In this post, we’ll demonstrate a robust method for measuring clock jitter using an example from Dr. Eric Bogatin’s webinar, “The Impact of Power Rail Noise on Clock Jitter.”  

The clock in our examples is a 5-stage ring oscillator which generates a square wave signal between 10 and 66 MHz. The test instrument is a WavePro HD 12-bit, 4-Ch, 8 GHz, 20 GS/s, 5 Gpts oscilloscope with 60 fs sample clock jitter.

In the process, we make a series of oscilloscope sample clock tests and timebase adjustments as  consistency checks. While measuring jitter is less about absolute accuracy than about the relative precision of measuring the time interval from cycle to cycle, a fundamental part of that is ensuring the absolute accuracy of the oscilloscope’s timebase.

04 May 2021

How to Use Memory Properly


In a recent post, we addressed setting sample rate for serial data acquisition, but let’s look again at how time per division (time/div), memory length and sample rate all interact, and what you can do to optimize your use of oscilloscope capture memory when setting up your timebase.
Figure 1: Sample rate as a function of time/div for three different memory lengths. Longer memory extends the range of time/div settings that support the highest sample rate.
Figure 1: Sample rate as a function of time/div for three different memory lengths.
Longer memory extends the range of time/div settings that support the highest sample rate.

09 November 2020

Fundamentals of Power Integrity: Mutual Aggressors and Rail Transient Response Measurement

Fig 1. Rail droop in response to a load step is a typical case of mutual aggressors in a PDN.
Fig 1. Rail droop in response to a load step is
a typical case of mutual aggressors in a PDN.
A third type of noise found in PDNs is what we call mutual aggressors, which is crosstalk coupling from one component of the PDN onto another.

An obvious example is a load step in the PDA, where something in the system being turned on pulls current from the VRM that supplies a rail. In Figure 1, you can see how the output voltage of the VRM supplying a 1 V rail droops in response to a load step before it recovers. This is still noise: it is a signal variation that we're not expecting and don't want.

We want to be able to characterize that noise, because too much droop could affect the operation of other components that are already consuming power from that device.

In order to do so, we’re going to measure the rail transient response to the load application. We need only look at two signals: the voltage and the current on the rail of interest. Figure 1 shows the voltage on C5 (the green trace) and the current on C8 (the orange trace).

21 September 2020

Fundamentals of Power Integrity: Board Pollution

Figure 1. "Pollution" occurring on PDN traces.
Board pollution is noise occurring on the packages and interconnects (traces and planes) that carry current from the VRMs to the consumer devices.
One place it can originate is from the VRM itself, for example, with the switching noise the VRM generates (Figure 1). That can be a real concern if the board capacitance means you have a resonance around the switching frequency that would act as an amplifier for the switching noise and cause all kinds of problems with other devices on the board.

14 September 2020

Fundamentals of Power Integrity: Self-aggression Noise

Fig. 1: VRM-switching noise is a self aggressor that can be identified because it is synchronous with the PWM clock.
Fig. 1: VRM-switching noise is a self aggressor that can be
identified because it is synchronous 
with the PWM clock. 
Self-aggression noise is so-called because it is inflicted by a component onto itself through its normal operation; nothing else in the system is affecting it. When we look for this, we want to ensure the system is in a steady state, in a place where the noise environment is fairly clear (e.g., the device is on an evaluation board).

An example of self-aggression would be VRM-switching noise. Figure 1 shows ripple on a 900 millivolt rail (yellow trace) at a time when no load is present. One of the things that tells us this is switching noise is that it is synchronous to the PWM clock (red trace). Ripple that is synchronous with the switching clock is a typical figure of merit for identifying switching noise.

31 August 2020

Fundamentals of Power Integrity: Characterizing PDN Noise

Figure 1. Noise tolerances for embedded system components are becoming ever tighter.
Figure 1. Noise tolerances for embedded system
components are becoming ever tighter.
Power integrity concerns maintaining the quality of power from generation to consumption in an embedded system. “Good” power integrity could be defined as having noise levels that are within tolerance. This short series will focus on characterizing noise on your power delivery network (PDN), with the goal of knowing where you must adjust your design to meet those tolerances.

Why do we care about voltage rail noise? As electronic designs strive for ever lower power consumption, power rails already carry very low voltages, often 1 V or less. Components like RF receivers, ADCs and DACs can be affected by noise of less than 1% of the rail value (Figure 1). This means noise tolerances can be as tight as single-digit millivolts, which is why power integrity takes up considerable validation time in labs.

22 June 2020

Build Your Own Low-Cost Power Rail Probe

Source series termination of a coaxial cable is a low-cost alternative for probing low-voltage, high-bandwidth signals.
Figure 1: The source series termination method is
a low-cost alternative for probing low-impedance,
fast-switching sources.

In an earlier post, we discussed the limitations of  Using 50-Ohm Coax from DUT to Oscilloscope  with low-voltage, high-bandwidth signals, like power rails. In this post, we’ll explain how to build your own, low-cost power rail probe to serve the purpose.

The source series termination method is a good alternative for probing a low-impedance, fast-switching source, comprising a 50-ohm resistor in series between the DUT and the coaxial-cable connection. The coaxial cable is then connected to the oscilloscope’s analog input set for 1 megaohm termination. An equivalent circuit model and a simple implementation appears in Figure 1.

19 April 2018

IoT Digital Power Management and Power Integrity

The half-bridge output current from each DC-DC phase is known as the inductor current
Figure 1: The half-bridge output
current from each DC-DC phase
is known as the inductor current
An Internet of Things (IoT) device derives its power either from a 12-V DC supply or from a battery. In either case, power is fed to one or more power rails that operate at different voltages. These rails power the CPU and other functional blocks on the PC board. In this post, we'll take a look at how to examine an IoT's power supply for proper digital power management implementation and for power integrity.

16 April 2018

Anatomy of an IoT Device

IoTs include SOCs, DDR, DPM ICs, wireless, and MCUs
Figure 1: IoTs include SOCs, DDR,
DPM ICs, wireless, and MCUs
There's already more Internet of Things (IoT) devices deployed than there are humans on Earth. That gap will increase radically in coming years, and the explosion in IoT devices means a commensurate explosion in the need for debugging tools. So what's in an IoT device to debug, anyway?

19 January 2018

Bandwidth vs. Current Load in Power-Rail Measurements

Connecting a 6" length of coaxial cable between a low-impedance DUT and a 1-MΩ produces ringing artifacts on your signal acquisition
Figure 1: Connecting a 6" length of coaxial cable between
a low-impedance power rail and a 1-MΩ input impedance
produces reflections and ringing artifacts
on your signal acquisition
Among the various challenges we've discussed in measuring noise on power rails are RF pickup and signal-to-noise ratio (SNR). Here's another: how do you achieve high bandwidth in your measurements while also minimizing current load on your DUT? Given that your DUT is a power rail, you really don't want to draw too much current from it. But these two measurement criteria are at loggerheads with each other. It's a quandary, and it has to do with the fundamental nature of signals on interconnects.

27 November 2017

Probing Techniques and Tradeoffs (Part III)

Bandwidth is defined as the frequency at which the ratio of the displayed amplitude to the input amplitude is -3 dB (or 0.707)
Figure 1: Bandwidth is defined as the frequency at which
the ratio of the displayed amplitude to the input amplitude
is -3 dB (or 0.707)
Any discussion of oscilloscopes and/or probes must include the topic of analog bandwidth. Bandwidth is one of a short list of key specifications for a testbench setup. All oscilloscopes and probes come to market with a bandwidth specification, which is defined as:

The frequency at which the ratio of the displayed amplitude to the input amplitude is -3 dB (or 0.707).

This is known as the "-3 dB point," or the half-power point (Figure 1). At this frequency, a sine-wave input signal is attenuated to 70.7% of its true amplitude. Any higher frequencies will likely be distorted on the display, making accurate measurements and calibration impossible.

30 October 2017

The Power Integrity Measurement Mindset

power integrity measurement logic wheel
Figure 1:  The holistic view
of power integrity
In kicking off a series of posts on power integrity measurements, it might be helpful to start with some thoughts on the mindset, or approach, that one should take in the endeavor. Power integrity is best approached holistically, with an eye toward each of the paths energy may take throughout a system.