You need to test, we're here to help.

You need to test, we're here to help.
Showing posts with label S-parameters. Show all posts

05 July 2022

A Tale of Two Calibrations: Vector Network Analyzer vs. WavePulser 40iX

Figure 1: This sequence diagram of the classic SOLT 2-path calibration shows the order of connections required.
Figure 1: This sequence diagram of the
classic SOLT 2-path calibration shows
the order of connections required. 
It was the best of S-parameter measurements, it was the worst of S-parameter measurements…and the difference was in the calibration.  Calibrating a vector network analyzer (VNA) before making any measurements is required in order to reduce errors from imperfect channel matching, less than optimal directivity in the directional couplers and cable response issues. While VNAs are precisely calibrated at the factory, that calibration only extends to the front panel measurement ports. There will inevitably be drift on the internal paths over time. Also, any cables, adaptors or fixtures connected to the measurement ports must be characterized and de-embedded in order to make exact measurements of the device under test (DUT).  

There are many possible calibration methods depending on the number of ports and paths being measured.  For simplicity, let’s consider the common 2-port, 2-path calibration.  This calibration method will yield a full set of S-parameters for the two ports: S11, S12, S21 and S22.  It requires the use of a short, open, load and through (SOLT) calibration reference standard, along with the cables used in the test setup, as shown in Figure 1.

21 June 2021

Automotive Ethernet MDI S-parameter Testing

Figure 1: MDI S-parameter tests treat the Base-T1 pair as a balance transmission line and check that reflections don't cause either excessive power loss or mode conversion that can disrupt the signal.
Figure 1: MDI S-parameter tests treat the Base-T1
pair as a balance transmission line and check that
reflections don't cause either excessive power loss
or mode conversion that can disrupt the signal.
As said earlier, the automotive industry has very stringent EMC/EMI requirements, and all Automotive Ethernet standards are designed to ensure good operation even in the presence of high EMI. Not only is there the potential for interference from all the different electronic systems within the vehicle, nothing is stopping you from parking your vehicle below high-voltage transmission wires or in other high EMI fields. 

For this reason, all Automotive Ethernet standards have defined S-parameter tests to be performed at the Medium Dependent Interface (MDI). The assumption is that the single twisted pair that is the basis for all Base-T1 transmissions can be treated as a balanced, differential transmission line with some crosstalk. It is a very real-world application of S-parameters, which can seem so academic.

Two, mixed-mode S-parameters are measured at the MDI reference plane. The tests ensure that there is neither too much loss of power from reflections, nor too much mode conversion into differential signal, that it will disrupt the information of the PAM3 encoded signal.

24 May 2021

Mode Conversion

Figure 1: The lower-left and upper-right quadrants of this matrix show the S-parameters that represent mode conversion from differential to common signal, and vice versa.
Figure 1: The lower-left and upper-right quadrants of this
matrix show the S-parameters that represent mode conversion
from differential to common signal, and vice versa.
As said earlier, mixed-mode S-parameters describe the general case of combinations of differential and common signals. When we speak of mode conversion in mixed-mode S-parameters, we are referring to the change of a differential signal into a common signal, or a common signal into a differential signal, as it travels the transmission line. If we look at the matrix of mixed-mode S-parameters in Figure 1, we see that those mixed mode S-parameters affected by such a mode conversion—with a different type of signal going out than what went in—are in the lower-left and upper-right quadrants.  

Let’s take the S-parameters SCD11 and SCD21 to see how the combination of single-ended S-parameters they represent reveal the source of mode conversion. If we look at SCD11, the reflected mode conversion, as a function of its single-ended S-parameters, we see:

17 May 2021

Converting Single to Mixed-Mode S-Parameters

Figure 1: Model of two transmission lines with crosstalk showing the transmission and crosstalk related S-parameters.
Figure 1: Model of two transmission lines with crosstalk
showing the transmission and crosstalk related S-parameters.

We have introduced mixed mode S-parameters and developed a formal structure for handling them. It is now time to discuss converting single-ended S-parameters into mixed-mode S-parameters. This is important because every instrument manufacturer obtains mixed mode S-parameters by first measuring single-ended S-parameters, then converting them mathematically to mixed-mode. This assumes that the interconnects being measured are passive, linear and time invariant.  Let’s begin with our model of two transmission lines with crosstalk shown in Figure 1.

12 May 2021

Introduction to Mixed-Mode S-parameters

Figure 1: Single-ended vs. differential signal "world views" of S-parameters
Figure 1: Single-ended vs. differential signal
"world views" of S-parameters
We’ve treated single-ended S-parameters quite extensively in this blog. Links to several entries are listed at the bottom of this post. Now, we’re going to look at how we go from single-ended to mixed-mode S-parameters and what new information we can find in them. This will come in handy when we start looking at some of the MDI S-parameter tests that are performed for Automotive Ethernet compliance a bit down the road.

With single-ended S-parameters, we look at every combination of ‘going in signals’ and ‘coming out signals’. For example, two single-ended transmission lines and their return paths would yield a four-port S-parameter file. We take the complex ratios of each port combination to obtain the S-parameter value in the form of:

S_(OUT,IN) =  V_OUT/V_IN 

The bold typeface indicates complex quantities. 

But what happens if we drive two transmission lines with a differential source? Figure 1 compares the single-ended and differential signal world views.

19 October 2020

Which Virtual Probing Method to Use?


Virtual probing lets you "probe" where a probe can't reach, or compensate signals by deembedding or simulating devices and channels.
Virtual probing lets you "probe" where a probe
can't reach, or compensate signals by deembedding
or simulating devices and channels.
A great feature of Teledyne LeCroy oscilloscopes is the ability to apply virtual probing to compensate an input signal, whether by deembedding fixtures from the signal path, or simulating a “missing” component. It is especially helpful in cases where the signal is difficult to probe at the ideal location, hence the concept of “virtual” probing.

For example, because the JEDEC electrical specifications are defined at the balls of the DDR DRAM, it is often necessary to use the virtual probing capabilities of the oscilloscope to get the best representations of DDR signals to be analyzed with DDR Debug Toolkit or QualiPHY compliance software.

Here, we’ll give an overview of the virtual probing methods that become available with the installation of the SDAIII-CompleteLinQ or VirtualProbe software options, and some guidance as to which method is best to use in which case. And although we’ll show examples drawn from DDR analysis, the benefits of virtual probing are by no means limited to DDR signals.

24 August 2020

How to Connect the Returns to an Unshielded Twisted Pair

Figure 1. Three options for connecting a TDR to a UTP.
During a recent webinar, Dr. Eric Bogatin was asked several questions about how to measure unshielded twisted pairs (UTPs), which are differential pairs with no return path. Here is his answer to one of the questions. For more information, check out the whole webinar on Differential Pairs with No Return Paths.

Q: For the UTP measurement, do you need to connect the SMA connector shield grounds together?

A: Yes. It’s very important to make sure the grounds are connected at the cable connectors.

There are really three ways the connections can be made from a differential TDR to the UTP cable. These three options are shown clockwise from left to right in Figure 1.

27 May 2020

Reading S-parameters: Sharp Dips

Figure 1. A resonant cavity composed of two interior layers on a four-layer printed circuit board.  The return current from the signal path couples into the plane cavity and excites its resonance modes.
Figure 1. A resonant cavity composed of two interior layers
on a four-layer printed circuit board.  The return current from
the signal path couples into the plane cavity and excites its
resonance modes.
The last pattern we'll cover in this series on reading S-parameters is sharp dips. These dips result from coupling to high-Q resonant structures and represent very narrowband absorption in S21 or S11.

Where do you see resonant coupling? Resonant structures can include coupling to an interconnect that is floating and not terminated. The structure does not have to be a uniform transmission line, it can also be a cavity made up of two or more adjacent plates as shown in Figure 1. Commonly, when a signal goes through a cavity and we hit the resonances of the cavity, it absorbs energy and results in narrow dips in the S-parameters.

18 May 2020

Reading S-parameters: Broad Dips

Figure 1. Quarter wave stubs exhibit resonance which impacts S21 as broad dips.  The resonant frequency can be computed based on the characteristics of the transmission lines and its length.
Figure 1. Quarter wave stubs exhibit resonance which
impacts S21 as broad dips.  The resonant frequency
can be computed based on the characteristics
of the transmission lines and its length.
Besides ripples and monotonic drop offs, the third pattern commonly seen in plots of S-parameters are broad dips due to stub resonances. Figure 1 shows an interconnect which includes a stub.  The interconnect is composed of 50 ohm uniform transmission lines which incorporate a branch point with an open at the end. 

Not surprisingly, the open stub is a discontinuity. What's going to happen? At the open, it's going to reflect and head back. At the junction, it's going to branch. Some of it's going to go back toward the source and some of it's going to go forward toward the receiver.

11 May 2020

Reading S-parameters: Monotonic Drop Offs

Figure 1. As a signal propagates, the amplitude drops off exponentially with distance due to signal losses.
Figure 1. As a signal propagates, the amplitude drops off
exponentially with distance due to signal losses.
Last week, we showed how ripple in S-parameters relates to the length of the interconnect. The second common pattern we see when reading plots of S-parameters is the monotonic drop off in the amplitude of the transmission coefficient (S21), commonly referred to as the insertion loss. If we apply a sine wave and look at its amplitude as it moves through that interconnect, we see that it drops off exponentially as shown in Figure 1.

V_Out is shown as V_In times a decaying exponential. (Note that attenuation is usually described using base 10 rather than base e).

04 May 2020

Reading S-parameters: Ripples

Ripples in s-parameters show impedance discontinuities
Figure 1. Ripple patterns commonly seen in S11 and S21.
When we look at plots of S-parameters, we can observe four classic patterns that affect the S11 reflection coefficient (aka. return loss) and the S21 transmission coefficient (aka. insertion loss): ripples, monotonic drop offs, broad dips and sharp dips. In this post, we’ll look into how the characteristics of the interconnect affect the ripple pattern, which will help you better understand your own measurements. 

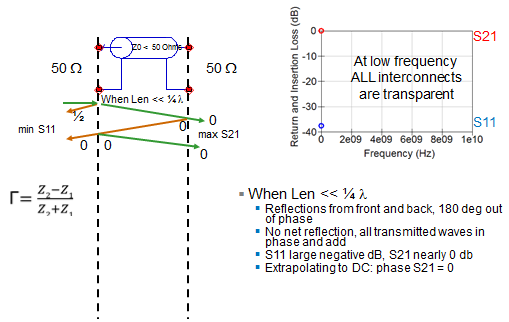
The ripples in S11 and sometimes in S21 in Figure 1 are due to reflections in the interconnect caused by impedance discontinuities. This phenomenon has been investigated in an earlier post, What S-parameters Reveal About Interconnects (Part III)

16 April 2020

Six Ways Not to be Confused by S-parameters (Part II)

In Part I, we discussed three causes of confusion when working with S-parameters and what you can do to avoid them.  In this post, we’ll discuss three more ways not to be confused by S-parameters.

4. Know the difference between return loss and reflection coefficient

Figure 1. A 2-port device has two distinctly interesting S-parameters, S11 and S21.  S11 is the reflection coefficient of Port 1 (also called return loss), and S21 is the transmission coefficient of Port 2 (also called insertion loss).
Figure 1. A 2-port device has two distinctly interesting
S-parameters, S11 and S21.  S11 is the reflection
coefficient of Port 1 (also called return loss), and
S21 is the transmission coefficient of Port 2
(also called insertion loss).
Let’s start by looking at a 2-port device illustrated in Figure 1.

There are two S-parameters of interest in a 2-port device.  The first is the reflection coefficient, S11, that measures the ratio of the reflection from Port 1 to the drive signal at that port.  The second is the transmission coefficient, S21, that is the ratio of the output of Port 2 to the drive signal into Port 1.  Confusion arises because historical measurements of return loss and insertion loss are often used interchangeably with reflection coefficient and transmission coefficient, respectively.

13 April 2020

Six Ways Not to be Confused by S-parameters (Part I)


S-parameters describe the electrical properties of electronic interconnects, which can include connectors, printed circuit traces and vias, cables, and oscilloscope probes. Given that instruments such as Teledyne LeCroy’s WavePulser 40iX make measuring S-parameters relatively simple, there are still some aspects of S-parameters that can cause confusion, especially to new users. Here are six things you can do to avoid confusion when working with S-parameters.

1. Know where the fixture ends and the DUT begins

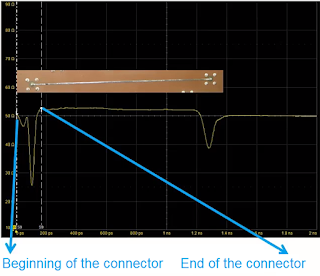
Connectors needed to make a measurement add their own characteristics to the measurement.
Figure 1. Characterizing a  microstrip line requires
two connectors, one at each end of the line. 
These connectors add their own characteristics to
the measurement. A TDR measurement can
determine the boundary between the connectors
and the microstrip PC line. 
Measuring S-parameters involves connecting a test instrument to the Device Under Test (DUT), placing the DUT in series with a number of other interconnect elements, as in Figure 1. The DUT is not isolated, and confusion can arise as to where you want the cables and fixtures to end and where the DUT begins. Do you want the DUT to include just the cable of the DUT? What about the connectors on its ends? What about the matching fixture or lead in in the circuit board?

10 July 2018

Serial-Data Channel Emulation and S Parameters

Higher data rates + "same old" channel media = degraded signal quality at receiver
Figure 1: Higher data rates + "same old" channel media
= degraded signal quality at receiver
Serial data rates have risen but propagation media for the channel remain unchanged, and that results in greater attenuation to the frequencies of interest. We could ignore these losses at lower frequencies, but now that rise times are so much faster, that's not an option. Channel effects now intrude into design margins to the point where eyes deteriorate and bit-error rates become unacceptable.

06 June 2018

A Look at Transmission-Line Losses

Using a 3D field solver to simulate a differential trace
Figure 1: Using a 3D
field solver to simulate
a differential trace
In surveying the subject of debugging high-speed serial data links, we've noted that there's no one cause for signal-integrity issues between transmitter and receiver, and there's certainly no one solution. But let's begin with the low-hanging fruit: electrical losses in the transmission line. We've previously done a series of posts on transmission lines (beginning here), but it's worth it to have a quick refresher.

16 February 2018

Probing Techniques and Tradeoffs (Part XI): Non-Ideal Situations

VP@Rcvr builds a transmission-line model to virtually move less-than-ideal probing points
Figure 1: VP@Rcvr builds a transmission-line model
to virtually move less-than-ideal probing points
In using an oscilloscope to investigate transmission-line performance, we often encounter situations in which we don't have the luxury of probing at the ideal location. Fortunately, there are software tools that enable us to virtually move our probing point close to the receiver.

17 December 2014

What S-parameters Reveal About Interconnects (Part III)

How ripple is introduced into S11 and S21
Figure 1: How ripple is introduced into S11 and S21
S-parameters are a great tool for understanding exactly what happens to a signal as it traverses an interconnect such as a transmission line. How much of it propagates through, and how much reflects off of impedance mismatches? From plotting return loss against insertion loss, we've weighed how much return loss may be tolerable before it significantly impacts insertion loss. Now we'll turn our attention to some common patterns exhibited by S11 and S21 and what they mean to the performance of an interconnect.

09 December 2014

What S-parameters Reveal About Interconnects (Part II)

Measuring S-parameters of a two-port interconnect
Figure 1: Measuring S-parameters
of a two-port interconnect
Having previously covered some of the fundamentals of S-parameters, it's now time to dig a little deeper into what they can show us about an interconnect; say, for example, a two-port microstrip line on a PC board. Unlike the one-port DUT in our earlier post, this configuration gives us the opportunity to look at not only S11 (return loss or reflected signal), but also S21 (insertion loss or transmitted signal).

03 December 2014

What S-Parameters Reveal About Interconnects

S-parameters are derived by applying an incident wave to an interconnect
Figure 1: S-parameters are derived by applying an incident
wave to an interconnect; we can consider this process in either
the time or frequency domains
S-parameters are a popular means of characterizing an interconnect. By feeding the interconnect with a precision reference signal and measuring how much of that signal propagates through the connector and how much is reflected, we learn everything we need to know about its performance. This will be the first in a series of posts about the insights we can glean from S-parameters with practical examples of common measurement scenarios.

15 May 2014

Back to Basics: S-parameters

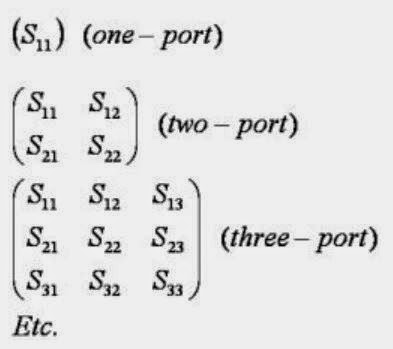
S-matrices for one-, two-, and three-port RF networks
Figure 1: S-matrices for one-, two-,
and three-port RF networks
Suppose you have an optical lens of some sort onto which you shine a light with a known photonic output. While most of the incident light passes through the lens, some fraction of the light is reflected and some is absorbed (the behavior is also dependent on the wavelength of the incident light). You'd like to characterize that lens: Exactly how much light was reflected? How much passed through? What is it about the lens that prevented all of the light from passing through?