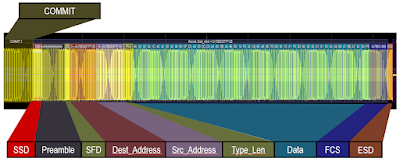
 |
| Figure 1. Color-coded decoding of 10Base-T1S stream makes it easy to measure timing between signal elements. Click on any image to enlarge. |
PLCA cycle timing is measured to assure interoperability of the attached nodes in a 10Base-T1S mixed-segment, multidrop bus. This class of tests measures the timing between events on the bus relative to a specific bus event, usually the BEACON signal initiated by the Master node.
Let’s look at a simple example of a 10Base-T1S network with two nodes, the Master (Node 0) and a device (Node 3). The acquired waveform is shown in Figure 2, decoded using the 10Base-T1S TDME option. The top grid shows the complete acquisition, which consists mostly of BEACON signals over a record of twenty-five million samples. Toward the end of the acquisition are two packets from the other nodes. The table at the bottom of the screen lists all the elements decoded in the full acquisition.
Measuring BEACON Duration
 |
| Figure 2. Cursors on zooms precisely measure duration of BEACON signal. |
Horizontal relative cursors can also be used to measure timing on the decoded signal with better precision. A good way to assure the best accuracy in a cursor measurement is to first zoom the trace being measured. Cursors are initially placed about the BEACON signal on the decode trace Z1 using either the front panel Cursor button or the Cursor drop-down menu. Then, further zooming the Z1 trace into Z3 allows the cursors to be moved and placed with much greater accuracy at the beginning and end of the BEACON. Ideally, the cursors should be placed at the logic switching threshold. The cursor time readout appears in the lower right corner of the screen under the timebase annotation box, reading 2.0820 µs. This is consistent with the 10Base-T1S specification that the BEACON duration be 20 clock cycles. At 10 MHz, this works out to 2 µs.
Measuring BEACON to Packet Timing
 |
| Figure 3. Cursors on two zooms used to measure time delay from end of BEACON to start of packet. |
The Time column of the table can be used to estimate the delay from the end of the BEACON to the beginning of the Node 3 packet. This is the difference between the start of the Silence that follows the BEACON and the Start of Stream Delimiter (SSD). The Silence begins at -84.2 µs and the SSD begins at -72.91 µs, a difference of 11.29 µs.
The cursors can be used as before, only this time, due to the length of the packet, two zooms are used to see both the end of the BEACON (Z3) and the beginning of the packet (Z4) with sufficient resolution to place cursors accurately. The significant measurement points on the zoom traces are aligned with the measurement points on zoom trace Z1. The measured time difference is 11.2128 µs.
Time differences between any fields of the decoded signal can be measured with cursors in this manner.
Measuring Time Between BEACONs
 |
| Figure 4. Applying filters and serial bus measurement parameters to measure time between BEACONs. |
Once the table is filtered, open the Measure/Graph tab and set up the Delta Message parameter, using the active Decode N as the source. In Figure 4, the time measured between BEACON transmissions is a minimum of 1.2608 ms, maximum of 1.3228 ms, and mean value of 1.28738 ms.
The TDME Measure/Graph tab also allows you to optionally graph measurement results as a track, trend, or histogram. In this example the track function is selected and routed to math trace F1. Each measured delay value is plotted time synchronously with the acquisition in the F1 math trace.
No comments:
Post a Comment