You need to test, we're here to help.

You need to test, we're here to help.
Showing posts with label trend function. Show all posts

11 April 2022

Setting Up Your Oscilloscope for ESD Pulse Testing

Figure 1: An ESD calibration test setup.  The ESD gun discharges its waveform into a properly attenuated current target.
Figure 1: An ESD calibration test setup. 
The ESD gun discharges its waveform
into a properly attenuated current target. 
Electrostatic discharge (ESD) pulse tests are a type of conducted immunity testing done to confirm that a device can withstand a sudden transient electrostatic discharge. It is done by using an ESD gun to shoot a pulse of the required voltage at a device while testing that the DUT continues to operate properly. The ESD pulse shape simulates a person, carrying a static charge, touching a device. When their fingertip first touches the device, there is a leading edge with a high peak and fast decay, often visible in the real world as a spark flying from the fingertip. This is followed by a second edge due to the charge in the rest of the human body that propagates toward the fingertip with a time delay.

Oscilloscopes are most often used to “test the tester” in ESD pulse test setups, confirming that the pulse from the ESD gun is the right shape and meets the requirements of the standard to which the device is being tested. A typical calibration test setup is shown in Figure 1. The pulse from the ESD gun is fired directly into a current shunt target connected to the oscilloscope through an attenuator required to keep the signal within the limits of the oscilloscope’s 50 Ω input, which is used for this testing. Then, key parameters of the ESD pulse are measured per one of several standards, such as IEC 61000-4-2.  

ESD standards require a range of measurements. The most common are the initial edge 10% to 90% rise time, peak amplitude, pulse width, amplitude and current levels at specified times from the initial edge (e.g., T1 and T2), and time to half value. 

Following are four, important things to do to make sure you get the best ESD pulse measurements from your oscilloscope.

04 April 2022

Oscilloscope Basics: When to Use Trend to Graph Oscilloscope Measurements

Figure 1: Applying the Trend operator to the same input waveform illustrates how the Trend is asynchronous to the input waveform.
Figure 1: Applying the Trend operator to the
same input waveform illustrates how the
Trend is asynchronous to the input waveform.  
In a previous post, we described the characteristics of the Track math function and two key applications of using Tracks to graph oscilloscope measurement data: anomaly detection and waveform demodulation. In this post, we'll discuss the characteristics and uses of the Trend function.

To illustrate an important distinction between Tracks and Trends, the Trend math operator in Figure 1 is now applied to the same signal as was the Track in our previous post without first reacquiring the input waveform. 

Note that unlike a Track, the Trend is not time-synchronized to the input waveform. Only the order of events, and not the timing of events, is retained. The underlying shape of the Track may be displayed in the Trend because the same measurement values from a single acquisition are displayed in the same sequence—however, the timing information of when each of the values has occurred is not retained in the Trend. Therefore, unlike the Track, the Trend does not point to the location of an anomaly. Without time scaling, the Trend does not have the frequency information needed to demodulate an input waveform.

29 March 2021

How to "Layer" Measurement Tools

Figure 1: Multi-grid display "layers" multiple measurement tools to find hidden glitch.
Figure 1: Multi-grid display "layers" multiple
measurement tools to find hidden glitch.
Teledyne LeCroy oscilloscopes have four, distinct sets of measurement tools, including measurement graticules, cursors, parameters and graphs. These tools developed historically and are designed to be “layered” on multi-grid MAUI® oscilloscopes so that each addition brings a new level of understanding and insight. Even on oscilloscopes that do not have multi-grid displays, as shown here, several measurement tools can be applied at once for added insight. Read on to see how, properly combined, they can help you find waveform anomalies and assess their frequency of occurrence in a few, simple steps.

08 May 2018

Debugging CANbus For IoT Devices

Temperature data from thermocouples is shown both encoded and decoded on the oscilloscope's display
Figure 1: Temperature data from
thermocouples is shown both
encoded and decoded on the
oscilloscope's display
A myriad of serial-data standards come into play when we're discussing Internet of Things (IoT) devices. We've talked about I2C, SPI, and UART in a previous post. Yet another serial-bus standard that comes under the IoT umbrella is the Controller Area Network (or CANbus) standard. CANbus enables microcontrollers and peripheral devices to communicate with each other in applications without an intervening host computer. In the past, it's been typically used in automotive applications, but CANbus has found its way into a wider scope of applications of late.

04 May 2018

Debugging Low-Speed Serial Data on IoT Devices

Serial-data links handle traffic between ICs and peripheral devices in the IoT world
Figure 1: Serial-data links handle traffic between ICs
and peripheral devices in the IoT world
Our last post discussed the difficulties in acquiring the many sensor signals that may be input to a deeply embedded system such as an IoT device as well as a hardware solution to the problem. Another aspect of IoT debugging and validation is the low-speed serial data standards used to facilitate communication between ICs and between controllers and peripheral devices (Figure 1). To that end, let's take a look at three such low-speed standards: I2C, SPI, and UART.

05 February 2018

Getting The Most Out Of Your Oscilloscope: Physical-Layer Tools

Trigger dialog boxes will match the protocol of interest
Figure 1: Trigger dialog boxes will
match the protocol of interest
Debugging and validation of the physical layer of serial-data links is a preeminent oscilloscope application area these days. Today's real-time digital oscilloscopes have a wealth of tools to help you dig into any/all serial protocols and learn what's really going on electrically with your serial links.

31 January 2018

Getting The Most Out Of Your Oscilloscope: Tracks and Trends

The track math function shows how data changes over time
Figure 1: The track math function
shows how data changes over time
Our discussion of cursors and parameters leads us neatly into the topics of tracks and trends, which are both means of extending parameter measurement into a more analytical direction. We can do this using math functions that are part of your Teledyne LeCroy oscilloscope's toolset.

14 July 2017

The Periodic Table of Oscilloscope Tools: Math

DSP-based Math functions can reveal deep insights hidden in waveforms
Figure 1: DSP-based
Math functions can
reveal deep insights
hidden in waveforms
The usefulness of oscilloscopes skyrocketed once digital signal processing began to be applied to acquired waveforms. By applying DSP, oscilloscopes could now perform complex processing in the time, frequency, statistical, and other domains, all while imposing no restrictions on acquisition length. Here at Teledyne LeCroy, we collectively refer to these DSP-based processes as Math functions. We've presented those functions, along with all of the other functions our instruments perform, in chart form in our Periodic Table of Oscilloscope Tools.

30 November 2015

Follow The Bouncing Signal

Trend plotting is a handy tool for discerning frequency-hopping patterns
Figure 1: Trend plotting is a handy tool
for discerning frequency-hopping
patterns
Signal jamming, noise generation/interference, signal interception, and other malicious RF-related activities have long been part and parcel of the electronic warfare arena. One countermeasure that is widely deployed is frequency hopping spread-spectrum (FHSS) transmission, or rapid and pseudo-random jumps of the carrier frequency in an effort to confound would-be jammers. FHSS transmission poses test and measurement challenges that we'll outline below.

27 February 2015

Using Histograms (Part II)

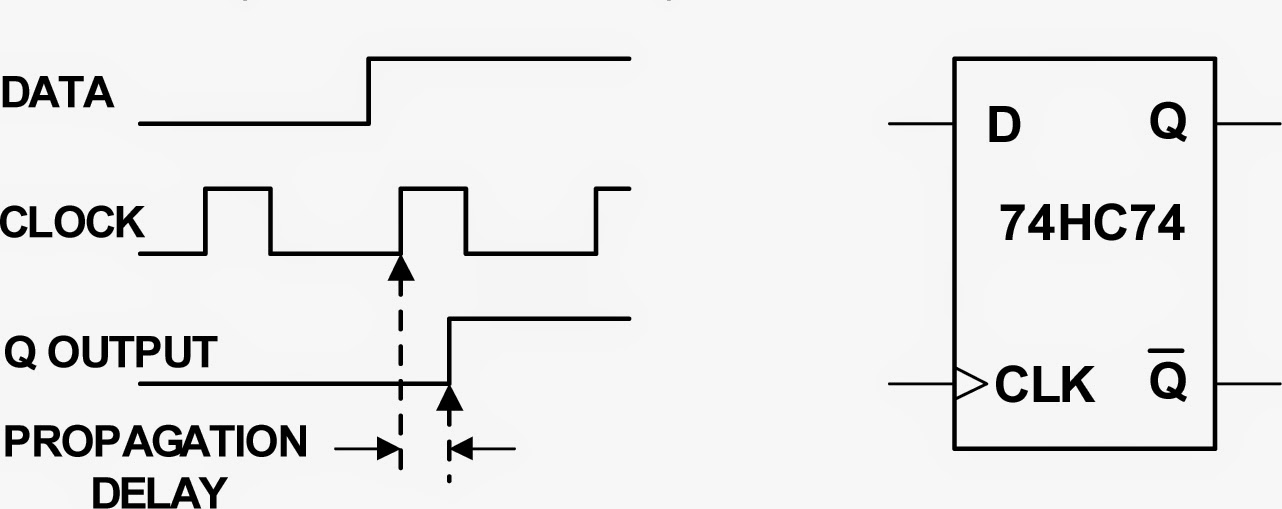
Figure 1: A flip-flop's propagation delay is a typical spec that can be derived using statistical analysis
Figure 1: A flip-flop's propagation delay is a typical spec
that can be derived using statistical analysis
In Part I of this series, we looked at some of the basics of histograms and how they can provide a statistical view into random variation of signal parameters. Next, let's look at how histograms can help us use statistical analysis to determine product specifications.

12 March 2014

Use Trend Functions To Take Power's Pulse

When troubleshooting or debugging almost anything, the first step is usually to check what's going into the device or circuit and what's coming out on the other side. So it is with power supplies, which leads us to power line monitoring and trend functions.