You need to test, we're here to help.

You need to test, we're here to help.
Showing posts with label DC coupling. Show all posts

10 January 2022

Oscilloscope Basics: Stabilizing Waveform Display, Pt. 2

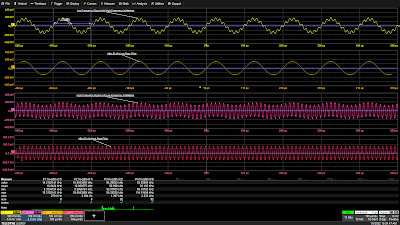
Figure 1: A 50 kHz low-pass filter eliminates a 93 kHz interfering signal from a 10 kHz signal (top two grids) and a 50 kHz high-pass filter cleans up a 93 kHz signal with an additive 10 kHz interfering signal (bottom two grids). Click image to expand.
Figure 1: A 50 kHz low-pass filter eliminates a
93 kHz interfering signal from a 10 kHz signal (top two grids)
and a 50 kHz high-pass filter cleans up a 93 kHz signal
with an additive 10 kHz interfering signal (bottom two grids).
Click image to expand.
In Pt. 1, we discussed the fundamental cause of unstable waveform displays. In this post, we’ll discuss how to use signal conditioners and conditional triggering to help the oscilloscope ignore extraneous samples when determining where the acquisition trigger event actually occurs.

Coupling 

In the Setup section of the Trigger dialog, Trigger input sources can be conditioned using AC or DC coupling, high-pass filters (LFREJ for low-frequency reject) and low-pass filters (HFREJ for high-frequency reject). The frequency selective coupling paths are used to attenuate extraneous signals. The low-frequency reject inserts a 50 kHz high-pass filter in the trigger signal path, which is useful for eliminating low-frequency interference such as 60 Hz power mains signals. This low-frequency noise can cause erroneous triggers, resulting in an unstable display. The high-frequency reject inserts a 50 kHz low-pass filter. This coupling mode finds use in applications such as troubleshooting switch-mode power supplies, where it suppresses signals at the power supply switching frequency. Like any extraneous signal, high frequency pickup can leak into the input signal and cause trigger instability. Figure 1 provides examples of how the HFREJ and LFREJ coupling filters eliminate interfering signals from the trigger source.

19 July 2021

How to Test Noisy Power Supply Outputs

Figure 1: 3.3 V output of a DC-DC converter. The waveform shows the nominal DC level, ripple and high frequency noise bursts.
Figure 1: 3.3 V output of a DC-DC converter.
The waveform shows the nominal DC level,
ripple and high frequency noise bursts.
Did you ever acquire the output of a power supply with your oscilloscope and find an unexpectedly high level of noise? Did you try adding filter capacitors only to find the noise level was not changed? 

In this post, we'll discuss how the choice of probe affects the noise present in power measurements, as well as how oscilloscope settings such as termination impedance, bandwidth and coupling can be adjusted to lessen noise and improve measurement results.

Figure 1 shows a typical DC-DC converter output measurement. The mean value of the waveform is 3.294 V.  Ripple appears at the switching frequency of 1.2 MHz, and noise in the form of high frequency bursts and baseline thickening is visible throughout.

Waveforms like this can be acquired with a 10:1 high impedance probe, a 1:1 coaxial cable connection, or a 1.2:1 rail probe using either DC or AC coupling, as available.  Figure 2 summarizes how each oscilloscope/probe configuration affects the measurement.

01 June 2021

Five Tips to Improve Dynamic Range

Dynamic range is the ratio of the maximum signal level to the smallest signal level achievable in a measurement.  Tools with good dynamic range are especially helpful for analyzing wide dynamic range signals in which a full-scale signal must be acquired, while at the same time, very small amplitude signal details must be visible. Here are five tips for improving the dynamic range of your measurement instrument.