You need to test, we're here to help.

You need to test, we're here to help.

22 February 2021

Don't Attach Multiple Probes to the Same Place at the Same Time!

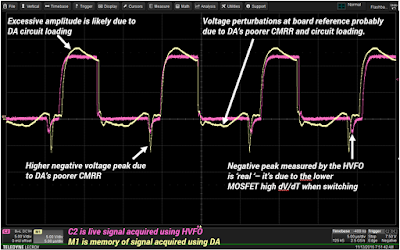
Figure 1. Response of two different probes to an
upper-side gate drive measurement.
Along with using single-ended passive probes for high-voltage measurements, another probing "no no" to avoid is attaching multiple probes to the same place at the same time.

You are probably aware that all measuring instruments, including oscilloscopes, are subject to conditions of observability.  As we discussed in a recent post on The Impact of the Interconnect, the very act of connecting the oscilloscope to the circuit with a particular probe affects the measurement in a particular way. Probes affect the circuit by applying additional resistance and capacitance loads in parallel with the circuit at the test point. Moreover, the probes themselves limit the fidelity of the measurement due to limits of bandwidth, slew rate and common mode response. So, it is always a good idea when making a measurement to compare how different probes/interconnects will affect the measurement…but don’t try to do it all at once.  

15 February 2021

Don't Probe HV with Single-ended Passive Probes!

Figure 1. A simple 120 Vrms switch-mode power supply
has a +/- 170 V peak and a 340 V pk-pk, difficult for
most single-ended passive probes to ground safely.

The high-impedance passive probes distributed with oscilloscopes of every major brand are sturdy, reliable and accurate within their specification limits, but they’re not intended for all applications.  This is especially true when measuring switch-mode power devices or other (relatively) high-voltage systems. These applications require probes that are both rated for their high voltage levels and isolated from ground as a reference voltage.  

High-impedance passive probes generally have maximum voltage limits of about 500 V and are ground referenced—meaning, one side of the probe is connected physically to earth ground through the oscilloscope.  If you’re measuring a single-phase 120 V line input to a power supply or inverter, you should be careful when connecting the probe ground to power neutral, which may not always be at ground level.  Using a differential probe, which is not ground referenced, eliminates this concern.

08 February 2021

Using Spectrograms to Visualize Spectral Changes

Figure 1. The spectrogram shows a history of
change in a spectrum and highlights variations
in frequency or amplitude.

In our last post, we discussed spectral analysis of RF in the lab as part of developing situational awareness. Another tool for spectral analysis is the spectrogram.

The spectrogram is a display composed of the most recently acquired 256 spectra all stacked in a persistence display. It is a feature of the SPECTRUM-1 and SPECTRUM-PRO-2R options that highlights variations in acquired spectra, making dynamic changes immediately visible. 

The spectrogram in Figure 1 shows the timing dynamics of a power rail load variation in a three-dimensional (3D) plot with color persistence. The same data could also be rendered in a flat, two-dimensional (2D) spectrogram display, or using monochrome instead of color persistence.  

01 February 2021

Situational Awareness: RF Noise in the Lab

Fig. 1. Time domain (top) and spectral (bottom) views of
s
ignal shown in SPECTRUM-1 on a WaveSurfer 4000HD. 
Laboratories have multiple sources of RF that can affect measurements, like computers, cell phones, routers, local radio and TV stations, even a nearby airport. Knowing the RF background of your lab is another part of Situational Awareness. Only by knowing the background can you know what is actually due to the device under test.

One way to read RF is through spectral analysis of Fourier transforms (DFT and FFT). FFTs take a time domain view of a signal (e.g, amplitude versus time trace) and change it into a spectrum of amplitude plotted as a function of frequency. Frequency spectrums are great for observing signals than are asynchronous with the process being measured. They have a lower noise floor and offer better dynamic range than do time domain plots.  Consider the views of the same signal shown in the time domain and frequency domain in Fig. 1.