
 |
| Figure 1. The four levels and three eyes of the PCIe 6.0 PAM4 signal. Click on any image to enlarge. |
So, what can implementers expect as they retool for PCIe 6.0 Base Tx and Base Rx physical layer testing?
|
| Figure 1. The four levels and three eyes of the PCIe 6.0 PAM4 signal. Click on any image to enlarge. |
So, what can implementers expect as they retool for PCIe 6.0 Base Tx and Base Rx physical layer testing?

 |
| Figure 1: BERT and Oscilloscope connection for PCI Express 4.0 error detection. |
In Figure 1, a known pattern is connected from the BERT PPG D1 output to the PCIe DUT input via a 2.92 mm K-type cable. The DUT attempts to regenerate the same data pattern, while the DUT output is routed to both the BERT error detector input and the oscilloscope channel 1 via 2.92 mm K-type tables and a power splitter. An error-free reference signal is connected between the BERT D2 output to the oscilloscope channel 2, along with the error trigger signal from the error detector output to the oscilloscope channel 3. An oscilloscope Edge trigger is set on the rising edge of the error detector output signal on C3.
 |
| Figure 1: A challenge when testing embedded systems is to correlate events in a low-speed interface like SPI to events in a high-speed interface like PCIe. |
Take for example testing the initialization of the system. When power is first turned on, the ROM bios and flash memory initialize program elements that are required by the embedded system’s microprocessor. Once the initialization is complete, the microprocessor has to notify the motherboard via PCIe that it is active and ready to receive data via the high-speed serial bus. This all has to happen within 200 milliseconds.
 |
| Figure 1: These upstream lanes show unexpected equalization behavior. If you only had the electrical signals to work with, how would you begin debugging them? |
At PCI Express compliance events, or when doing pre-compliance testing in the lab, a transmitter link equalization test is performed to determine whether a device is capable of correct link equalization in isolation. A piece of test equipment, usually a protocol-aware BERT, acts as the link partner for the device under test. The BERT requests specific preset changes from the device, in response to which the device (in theory) changes its preset to provide the correct channel compensation. The changes are captured by an oscilloscope, which is capable of visualizing the transmitter equalization changes in the electrical layer and measuring first of all, if they happen quickly enough, and secondly, if the device actually changed to the preset levels requested, which occur in a known sequence.
But what happens when you suspect "weird" equalization behavior in a live link between two devices—for example, something off with the upstream equalization in Phase 3? How would you capture that to begin debugging the problem? Where would you look for a clue as to what is happening?
 |
| Figure 1: CrossSync PHY for PCIe lets you easily map the electrical to the protocol layer of L1 substate events. |
 |
| Figure 1: A PCIe link between root complex and end point. Each device has its own transmitter and receiver. |
 |
| Figure 1: CrossSync PHY captures everything from physical through protocol layers at once. |
ProtoSync is an option for Teledyne LeCroy oscilloscopes with bandwidths that support high-speed serial data analysis. We’ve released ProtoSync options for PCIe, USB, SAS/SATA and Fibre Channel. ProtoSync links the same Protocol Analysis Suite software that is used with our protocol analyzers to the oscilloscope application, so that you can see physical layer decodings in the familiar PETracer and BITracer views right next to the decoded analog waveform.
CrossSync PHY differs from ProtoSync in the three, significant ways:
 |
| Figure 1. PCIe specifications through Rev 5.0. |
 |
| Figure 1: These images depict the degradation of serial data traffic as it makes its way from transmitter to receiver |
 |
| Figure 1: A generic IoT block diagram shows serial-data links in blue |
 |
| Figure 1: A diagrammatic view of the PCIe 3.0 dynamic link training process |
 |
| Figure 1: With an add-in card as our DUT, we will measure the transmit signal at the root complex on the system board |
 |
| Figure 1: The two basic PCIe 4.0 transmitter tests are shown above outlined in green |

 |
| Figure 1: An overview of the elements of PCIe 3.0 dynamic link equalization |
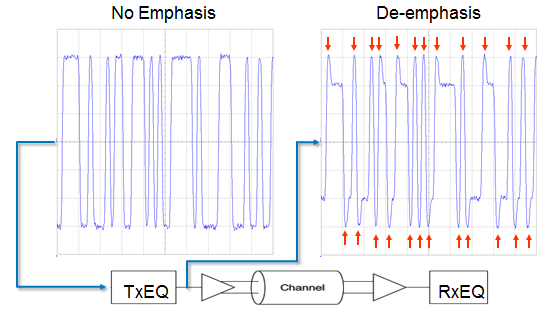 |
| Figure 1: De-emphasis, a key transmit-side equalization technique for PCIe 3.0, boosts high-frequency content |
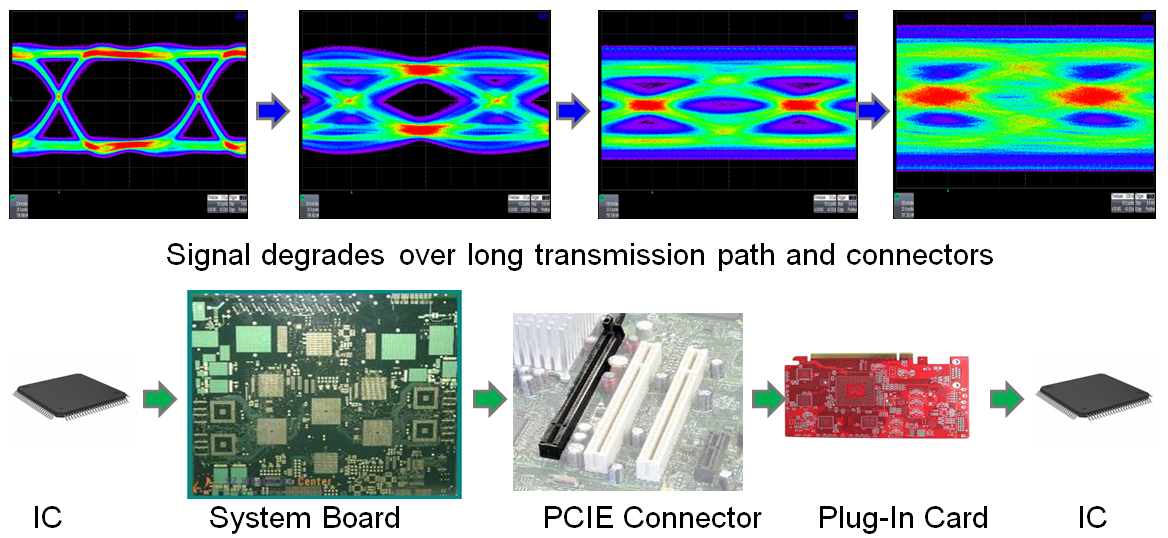 |
| Figure 1: SI problems are the root cause for dynamic link equalization in PCIe 3.0 |