 |
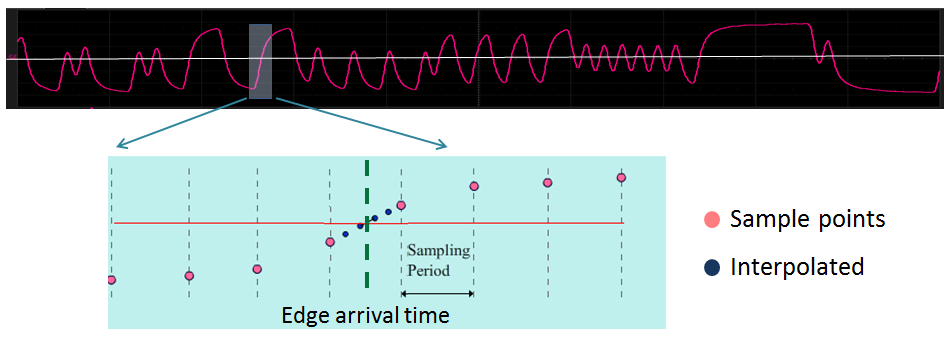
Figure 1: The first step in quantifying jitter is to
determine measured times of arrival for bit transitions |
A recent post covered some of the reasons
why one might want to measure jitter. In design and debug of serial-data channels, jitter is among the most prevalent causes of unacceptable bit-error rates (BERs). In that earlier post, we looked at the physical phenomenon of jitter and why it wreaks the havoc that it does. In the present installment, we will look in broad terms at how jitter is measured and quantified.
As noted, jitter causes bit errors because an edge arrives too late or too early. The measurement of this earliness or lateness is the time-interval error (TIE). We measure the TIE values in the waveform by first determining the measured arrival times of the edges in the bit stream (Figure 1). That's derived by determining when each edge crosses a threshold. Many of today's real-time digital oscilloscopes are able to capture this data.
 |
Figure 2: Determining expected edge arrival times
with a clock/strobe signal being transmitted |
The next step is to determine the expected arrival times of the bit stream's transitions. There are two scenarios for this process, each related to a particular means by which the receiver determines when to latch a bit.
The first scenario is when a reference clock and/or strobe is transmitted, as with dual-data-rate (DDR) memory channels, where a strobe signal derived from a clock latches the bit high or low (Figure 2). In such scenarios, the expected arrival times of the data edges are defined by the measured arrival times of the strobe signal's edges. Again, the crossing time of the strobe signal will almost always fall between samples, so interpolation is needed to determine the actual arrival time.
The second scenario is when no clock or strobe signal is transmitted, as with the USB protocol. In these cases, a clock and data recovery (CDR) circuit comes into play. The receiver generates a clock from an approximate frequency reference and then phase-aligns to the transitions in the bit stream with a phase-locked loop (PLL). A software CDR algorithm in the oscilloscope uses the bit stream to recover the underlying clock
 |
Figure 3: Histogram of the ΔT algorithm between
successive edges, from which the bit rate can be gleaned |
Two steps take place in this process. First, a software CDR algorithm determines the bit rate of the stream using the assumption that the correct bit rate minimizes the average TIE of the entire waveform. The bit rate is derived from analysis of the edge times. One such CDR algorithm analyzes a histogram of the ΔT between successive rising edges, the results of which are analyzed to determine a first-pass bit rate (Figure 3). Additional steps, such as analysis of a scatterplot of edge times vs. the cumulative number of unit intervals (UIs) yields a slope from which a more precise bit rate is derived.
The second step is to determine the expected arrival times. Two methods may be employed, the first of which is to create a list of expected arrival times using a constant UI period. The nominal UI period is 1/bit rate; the assumption here is that the underlying clock is "perfect," or unvarying (assuming perfection is never a good idea!). The second method is to allow the UI time to vary using an emulated PLL on the oscilloscope. This method would correct for low-frequency jitter or "wander" in the underlying clock. Oscilloscopes allow users to select from a variety of PLL types; choose the type that best matches the PLL in the receiver circuit.
 |
Figure 4: A jitter track, encompassing the TIE values
for all edges in the waveform, is the basis for
subsequent jitter analysis. |
With all this data in hand, the TIE values for each transition in the bit stream may be ascertained (Figure 4). This is the data set you'll need for all subsequent jitter analysis: jitter tracks, jitter histograms, jitter spectra, and jitter decomposition into its constituent parts.
In later installments, we'll look at laying the groundwork for jitter analysis and at how one goes about breaking jitter down into its component parts.


No comments:
Post a Comment