 |
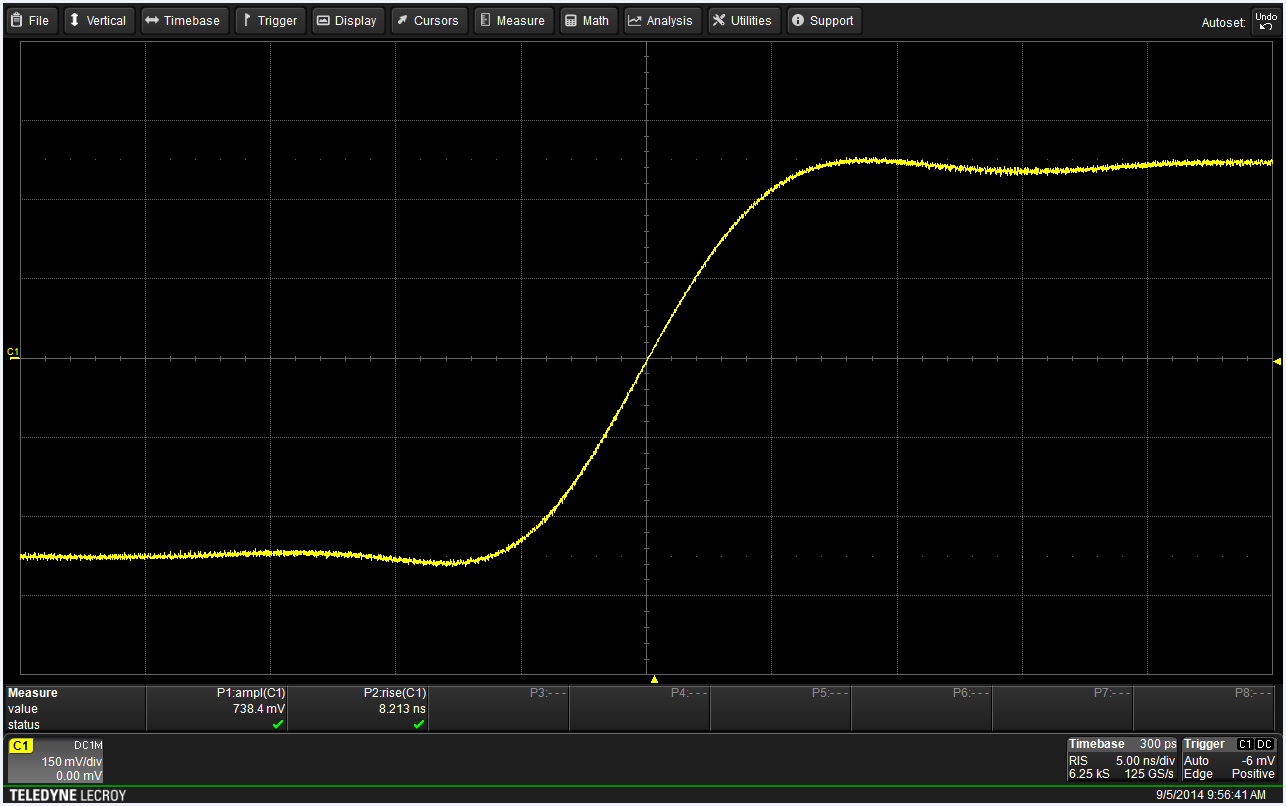
| Figure 1: The display graticule, the grid of intersecting lines overlaying the signal display area, is the original oscilloscope measurement tool |
But thinking back to the oscilloscopes of yore, though, techs and engineers didn't always have this kind of luxury. Early oscilloscopes had no such measurement tools. In fact, they really had only one: the display graticule. That grid of intersecting lines overlaying the signal display area was the first measurement tool of any sort added to oscilloscopes, and it's retained to this day not out of any sort of nostalgia, but because it's still a useful tool for quick "eyeball" estimates of what's going on with a signal. A sanity check, if you will.
Let's take a look at how to use the graticule to get an eyeball estimate. In Figure 1, we've input a step function on Channel 1 of a Teledyne LeCroy HDO6054 oscilloscope. Teledyne LeCroy instruments use a graticule consisting of 10 horizontal divisions and eight vertical divisions. Each division is further subdivided into five lesser divisions by hash marks on the center lines in each dimension.
The original intent of the display graticule was to help users visually estimate the waveform's amplitude and timing. In the case of our step function's amplitude, the waveform has a vertical displacement of about five divisions. Multiplying the displacement by the vertical sensitivity (150 mV/div, found in the Channel 1 descriptor box below the signal display area) gives us a signal amplitude of about 750 mV.
With respect to timing, rise time is typically defined as the time it takes a signal to rise from 10% to 90% of its final values. The two horizontal dotted lines at ± 2.5 divisions help us to get an eyeball estimate of signal rise time. To use these lines, adjust the signal amplitude to fit between the dotted lines using your oscilloscope's variable vertical sensitivity control. The dotted lines are five vertical divisions apart. The solid grid lines at ± 2 divisions represent the 10% and 90% levels. Measuring the difference of the crossing times gives us an estimate of the signal rise time. The Timebase descriptor box at the bottom right of the screen indicates that the horizontal sensitivity is 5 ns/div. In Figure 1, there are about 80% of two horizontal divisions at the ± 2 division solid grid lines between the two crossings. That gives us a rise time of about 8 ns.
For a sanity check on our "sanity check," we can measure the amplitude and rise time to confirm that our graticule-based estimates are in the ballpark. Turning on measurements and opening the P2 tab in the Measure dialog provides an overlay of blue dotted lines that define the rise time parameters. As shown in Figure 2, our eyeball estimates of both rise time and amplitude were pretty close. Actual amplitude is 738 mV; actual rise time is 8.160 ns. If more accurate numbers are required, that's what measurements are for.
With the wealth of measurement tools in our current generation of oscilloscopes, it's easy to overlook the humble display graticule. But with a little bit of practice, it's easy to learn to rely on it for those quick eyeball estimates.
 |
| Figure 2: Turning on amplitude and rise time measurements confirms the graticule-based estimates |
For a sanity check on our "sanity check," we can measure the amplitude and rise time to confirm that our graticule-based estimates are in the ballpark. Turning on measurements and opening the P2 tab in the Measure dialog provides an overlay of blue dotted lines that define the rise time parameters. As shown in Figure 2, our eyeball estimates of both rise time and amplitude were pretty close. Actual amplitude is 738 mV; actual rise time is 8.160 ns. If more accurate numbers are required, that's what measurements are for.
With the wealth of measurement tools in our current generation of oscilloscopes, it's easy to overlook the humble display graticule. But with a little bit of practice, it's easy to learn to rely on it for those quick eyeball estimates.
No comments:
Post a Comment