You need to test, we're here to help.

You need to test, we're here to help.
Showing posts with label rise time. Show all posts

18 January 2021

Situational Awareness: Testing Oscilloscope Outer Limits

Fig 1. 40 ps signal measured full bandwidth on a 1 GHz oscilloscope shows visible over/undershoot.
Fig 1. 40 ps signal measured full bandwidth on a
1 GHz oscilloscope shows visible over/undershoot.
Nothing is perfect. Every test instrument has its limits, and knowing the limits to your oscilloscope’s bandwidth in response to real-world signals helps to develop situational awareness when making measurements. This is especially true when testing signals that are at or very near the specified bandwidth limit of the instrument.

The measurements we’ll demonstrate were made on a WaveSurfer 4104HD, a 12-bit, 4-channel, 1 GHz bandwidth oscilloscope that samples at up to 5 GS/s.

01 March 2018

Transmission Lines (Part V): Reverse-Engineering the DUT

Every DUT can be thought of as a Thevenin voltage source with some internal resistance
Figure 1: Every DUT can be thought of as a Thevenin
voltage source with some internal resistance
There are always two primary elements of any test and/or measurement application: the oscilloscope and the device under test (DUT). Getting valid measurement results depends, first and foremost, on the oscilloscope's capabilities given the task at hand. It also depends on what we'll call "situational awareness," or the operator's understanding of the oscilloscope and of the characteristics of the DUT.

23 February 2018

Transmission Lines (Part II): More on Bandwidth vs. Rise Time

In the frequency domain (right), a near-ideal square wave displays predictable 1/f amplitude dropoff
Figure 1: In the frequency domain (right), a near-ideal
square wave displays predictable 1/f amplitude dropoff
We began this series about transmission lines by thinking about some pertinent principles and relationships that can help form our thinking about the topic. In particular, we'd covered the relationship between bandwidth and rise time and why we have this rule of thumb that says that bandwidth can be estimated using 0.35/10-90% rise time.

20 February 2018

Transmission Lines (Part I): Introduction

All oscilloscopes have a Cal output like the one pictured here
Figure 1: All oscilloscopes
have a Cal output like the
one pictured here
Somewhere on the front panel of almost any oscilloscope is a "Cal" reference signal output (Figure 1). That signal is really intended for adjusting the capacitance compensation screw to calibrate a 10X high-impedance probe, but most of us know it simply as the Cal signal. Have you ever noticed that the Cal signal's rise time seems to be highly dependent on the length of the cable attached to it, and maybe even wondered why?

06 December 2017

Probing Techniques and Tradeoffs (Part IV)

Applying bandwidth filters to a 2.5-GHz clock signal clearly shows the effect of bandwidth on rise time
Figure 1: Applying bandwidth filters to a 2.5-GHz clock
signal clearly shows the effect of bandwidth on rise time
The topic of probe bandwidth is a broad and deep one. We began our discussion of bandwidth in an earlier post with some basic information about what bandwidth means and the importance of the -3 dB point. Next, we looked at a Fourier deconstruction of a square wave into its fundamental and the lower-order harmonics, and covered the importance of bandwidth in capturing enough harmonic content to understand the signal's overall shape.

20 November 2017

Probing Techniques and Tradeoffs (Part II)

A snapshot of available probes from Teledyne LeCroy
Figure 1: A snapshot of available probes from
Teledyne LeCroy
Our first post in this series concentrated on connectivity and various means by which one might apply an oscilloscope probe to a circuit or device under test. Now, we'll look at an "ideal" probe vs. a real-world probe, and then begin a discussion of probe specifications.

28 September 2016

How Does Sampling Rate Affect ESD Pulse Measurements?

Characterization of an ESD pulse's rise time depends largely on the oscilloscope's sampling rate
Figure 1: Characterization of an ESD pulse's rise time
depends largely on the oscilloscope's sampling rate
In continuing our look at ESD/EMC pulse measurements, it would be useful to consider how sampling rate figures into the equation. What sort of sampling rate makes sense to use for capturing an ESD pulse? The answer to that question depends primarily on your pulse's rise time.

13 September 2016

Why IEEE's Pulse Definitions and ESD Pulses Don't Mix

The IEEE's pulse definitions, which don't fit the bill for measuring ESD pulses
Figure 1: The IEEE's pulse definitions, which don't fit
the bill for measuring ESD pulses
The IEEE's pulse definitions, found in the organization's Std 181-2011 that covers transitions, pulses, and related waveforms, set the bar for how pulse measurements are determined. These definitions, which are in the DNA of all oscilloscopes, are just the thing for measuring repetitive pulses such as clock signals but not so much for ESD/EMC measurement requirements. In this post, we'll discuss why that is and what you should do differently for measuring ESD pulses.

27 March 2015

Oscilloscope Basics: Choosing an Oscilloscope

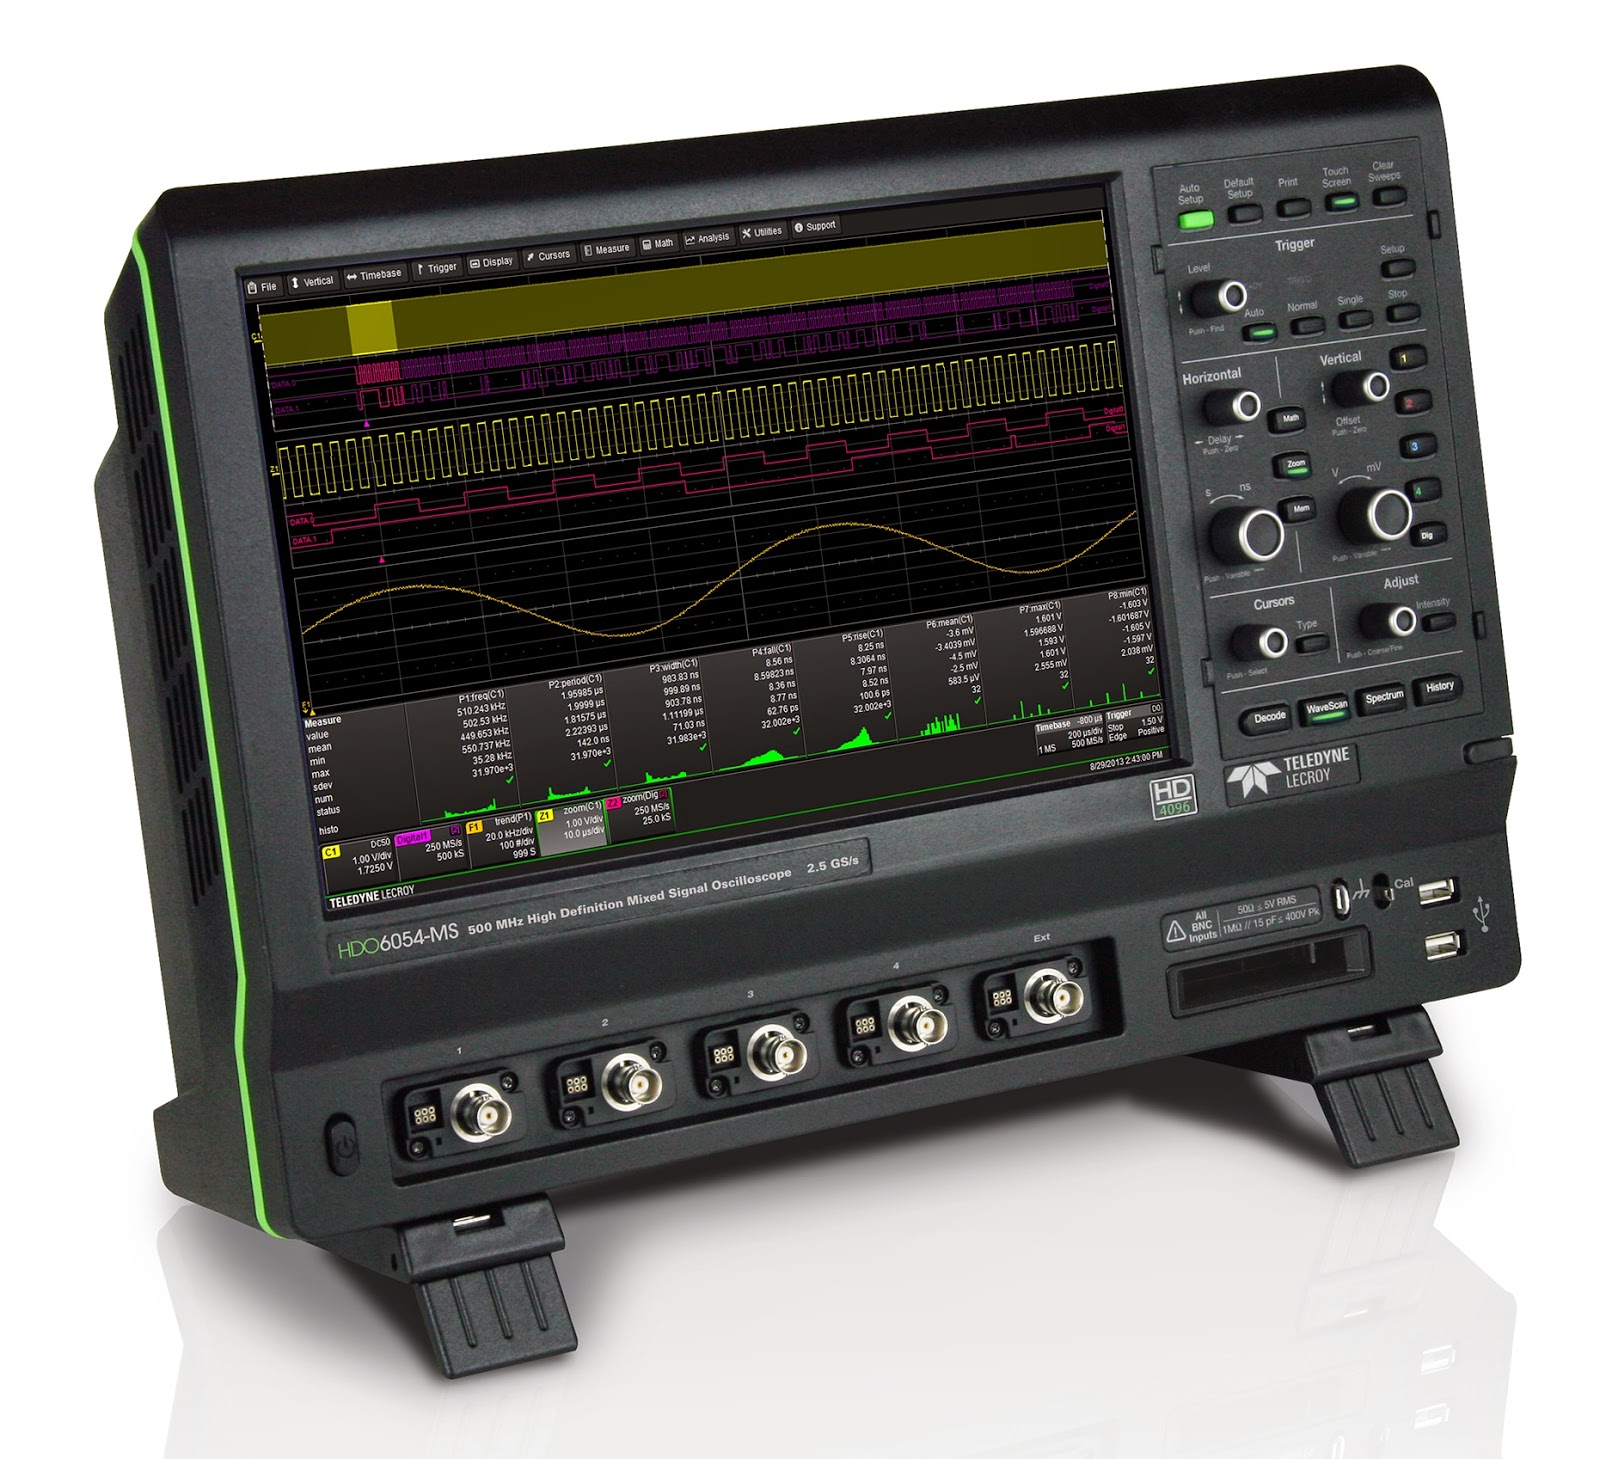
An oscilloscope such as Teledyne LeCroy's HDO6054-MS serves a very broad range of applications
Figure 1: An oscilloscope such as
Teledyne LeCroy's HDO6054-MS
serves a very broad range of
applications
Choosing an oscilloscope might seem to be a challenging task, but it doesn't have to be. Rather, it's a more-or-less logical process based on your measurement needs. Having said that, if the application for the instrument is "general lab work," the decision can become trickier.

05 September 2014

Oscilloscope Basics: Using The Display Graticule

The oscilloscope display graticule
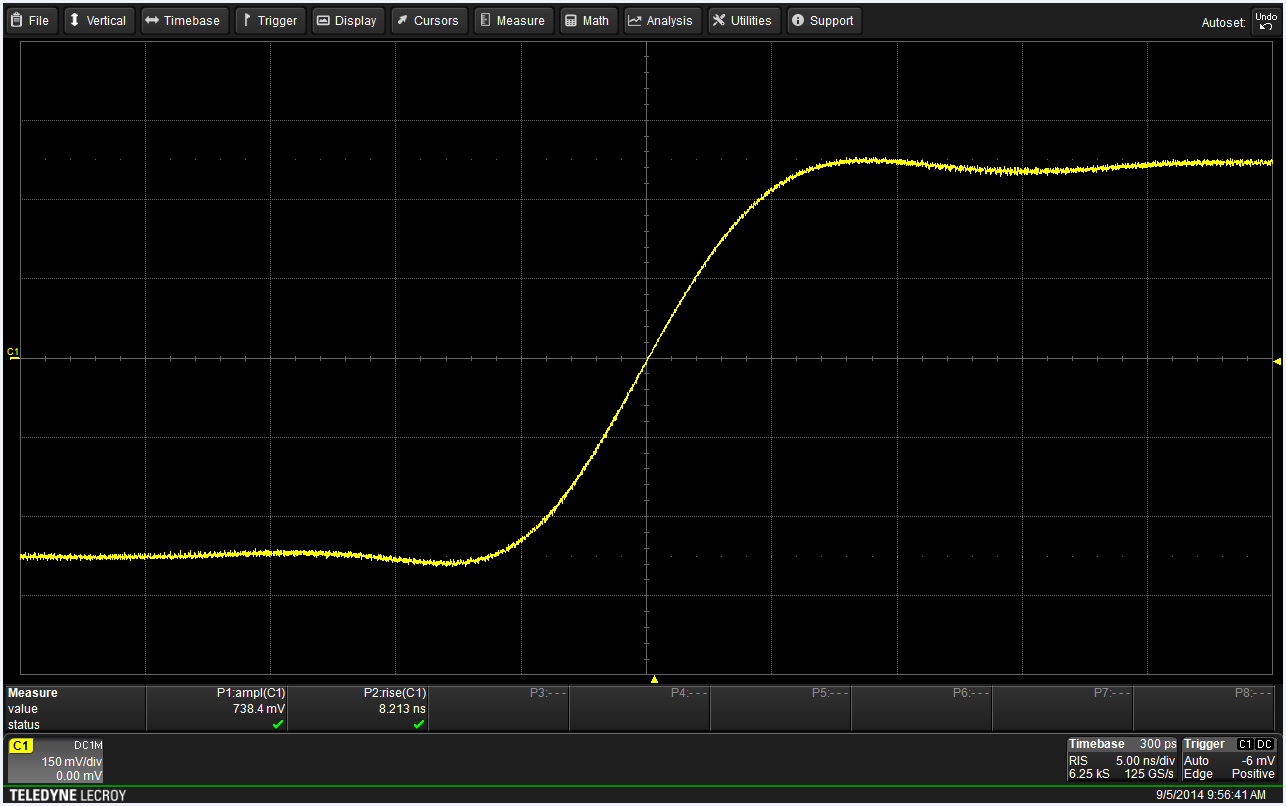
Figure 1: The display graticule, the grid of intersecting lines
overlaying the signal display area, is the original
oscilloscope measurement tool
Today's digital oscilloscopes come packed with an abundance of measurement capabilities, all available at the touch of a button or two. Want to know the amplitude of a square wave? Easy. Want to know the standard deviation of that amplitude? Minimum/maximum or mean? All easily compiled for you over hundreds or thousands of acquisitions.