 |
Figure 1: Using a band stop filter to remove a 5-MHz sine
wave from a 4-MHz square wave |
In a perfect world, all of the signals we wish to view on our oscilloscopes would be as pure as the driven snow. However, in most scenarios, reality intervenes. As we know, everything in a system is an antenna, some being more efficient than others in terms of radiation and/or reception. Hey, crosstalk happens, and if you've got a sine wave and a square wave co-existing in the same general vicinity, it could make a true evaluation of the square wave difficult to do. But how do we get that nasty sine wave coming from one circuit to stop jumping on the back of the square wave in another?
Ultimately, the answer most likely lies in improved decoupling, shielding, and other signal integrity approaches. For now, though, you just want to see what your square wave looks like. In that case, the answer is to apply digital filtering on your oscilloscope.
 |
Figure 2: Using a high pass filter to eliminate 60-Hz pickup
from a 63-kHz PWM signal |
Most modern digital oscilloscopes can be outfitted with a selection of filters: circuits (or devices) in which the output gain and phase vary as a function of the frequency of the input. A filter's frequency sensitivity is the ticket to removing some undesirable element of a signal or compensating for some frequency-dependent distortion.
If your oscilloscope happens to be one of ours, the
Digital Filter Package 2 (DFP2) option is compatible with most Teledyne LeCroy instruments. It offers a selection of several standard infinite impulse response or finite impulse response filters, including such types as low pass, high pass, band pass, or band stop filters. Users can also apply a custom filter configuration where needed.
 |
Figure 3: Removing baseline shaping by separating and
subtracting the low-frequency content of a waveform |
Let's look at an example of using a digital filter to remove an undesirable signal element. Consider a waveform that combines a 4-MHz square wave and a 5-MHz sine wave; we're interested in the square wave (Figure 1). The time-domain view of the signal appears in trace C1 and in zoom trace Z1. The frequency spectrum is shown in trace F1. Applying a band stop filter with band limits of 4.5 and 5.5 MHz effectively attenuates the unwanted 5-MHz sine wave, leaving the square wave much more viewable in the filtered output (seen in trace F2 and zoom Z2). Meanwhile, the spectrum of the filter output (trace F3) shows the reduction in the 5-MHz component.
Another example is the use of a high pass filter to eliminate 60-Hz pickup from a 63-kHz pulse-width-modulated signal (Figure 2). The high pass filter is set to attenuate signals lower than 200 Hz, thereby removing the 60-Hz hum.
 |
Figure 4: Using peak detection and filtering to
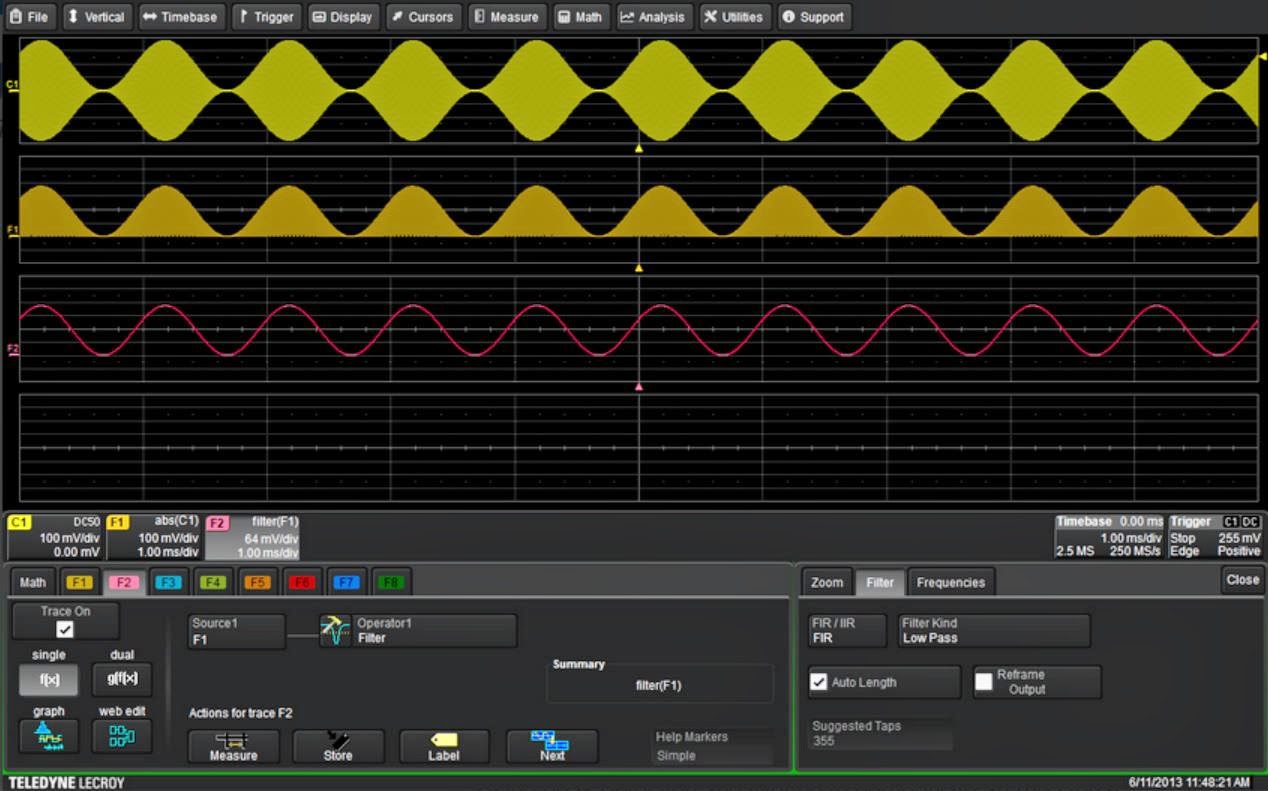
demodulate an AM signal |
Sometimes you'll encounter a signal with a shaped baseline (Figure 3). It's possible to use a low pass filter to separate the baseline and then subtract it from the acquired waveform. In this example, a low pass filter (trace F2) extracts the baseline, which is then subtracted from to acquired signal (Channel 1) in trace F3.
Finally, another spectral separation example shows the use of a low pass filter in a detector simulation (Figure 4). Modulation from an amplitude-modulated signal is extracted by peak detection and filtering. The absolute-value function performs full-wave peak detection. The DFP 2 option provides the necessary low pass filtering to remove the residual carrier from the detected waveform.
These are just a few examples of how digital filters can aid in signal analysis. Let us know what you've come up with.


No comments:
Post a Comment