| Figure 1: Jitter is short-term variation of a signal with respect to its ideal position in time |
What's all this "jitter" stuff, anyhow? A broad definition is "the short-term variations of a signal with respect to its ideal position in time." Jitter can manifest as instability in signal period, frequency, phase, duty cycle, or other timing characteristics. It's of interest from pulse to pulse, over many consecutive pulses, or as a longer-term variation.
There are a number of measurement and analysis techniques one can turn to for quantifying and estimating jitter. Among them are:
- Histograms
- Measurement track
- Time Interval Error (TIE)
- Jitter breakdown and extrapolation
 |
| Figure 2: Persistence display can serve for a quick eyeball estimate of total jitter in a signal |
Some of the persistence analysis tools one finds in some Teledyne LeCroy oscilloscopes include:
- Ptrace mean: Generates a mean waveform from a persistence map
- Phistogram: Provides a histogram of a vertical or horizontal slice through a persistence map
- Ptrace range: Generates a waveform with a vertical width derived from a population range (estimate of confidence interval) of a persistence map
- Ptrace sigma: Generates a waveform with a width derived from the sigma of a persistence map.
- Hold time: Time from the clock edge to the data edge
- Setup time: Time from the data edge to the clock edge
- Skew: Time of Clock1 edge minus time of nearest Clock2 edge
- Dperiod@level: Adjacent cycle deviation (cycle-to-cycle jitter) of each cycle in a waveform
- Dwidth@level: Difference of adjacent width above or below a specified level
- Duty@level: Percent of period for which data are above or below a specified level
- Edge@level: Number of edges in a waveform
- Freq@level: Frequency at a specific level and slope for every cycle in a waveform
- Period@level: Period at a specific level and slope for every cycle in a waveform
- TIE@level: Difference between the measured times of crossing a given slope and level and the ideal expected time
- Width@level: Width measured at a specific level
- Half period: Half period of a waveform
- dVdt: Local slope or "slew" rate
- Bit rate: Bit rate of a serial data stream
 |
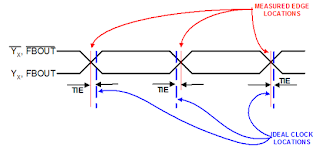
| Figure 3: Time Interval Error (TIE) is the difference between the measured clock edge and the ideal clock edge locations |
To look at one of these parameters a little closer, TIE@level, or Time Interval Error, is the difference between the measured clock edge and the ideal clock edge locations (Figure 3). Basically, TIE is the instantaneous phase of the signal. References can be chosen from a standard telecom frequency or set to a user-defined value. TIE can be plotted versus time or unit intervals (UIs), the latter being the period of time corresponding to one cycle of a given frequency.
A valuable tool is tracking of measurements, such as period, frequency, width, or duty cycle, to get a handle on how these measurements might be changing over time. Further, there is the ability to take a statistical view of jitter, which affords more reliable measurements thanks to the acquisition of more data.
In future posts in this series, we'll get into some of these topics in more detail.
No comments:
Post a Comment