 |
| Figure 1: Using the oscilloscope's Track math function can help pin down timing anomalies |
 |
| Figure 2: The parameter Track function reveals the cause of the timing problem of Figure 1: a missing clock cycle |
In this case, the Track waveform is a plot of the two skews, and you can see some spikes within the green box. Figure 2 reveals the cause of the spikes in the skew-to-skew Track waveform: a missing clock cycle. The end user wasn't aware of this issue, but the Track function is an example of a tool that can help determine why data isn't being transmitted correctly
 |
| Figure 3: The HDA125 high-speed digital analyzer enables triggering on the state of the DDR command bus |
An extremely useful tool for DDR debug is the HDA125 high-speed digital analyzer, which can be used with Teledyne LeCroy's DDR Debug Toolkit to perform some highly insightful mixed-signal analysis. The HDA125 can give you a close look at the DDR command bus.
 |
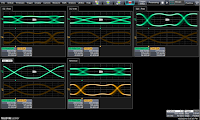
| Figure 4: Eye-diagram comparisons are an invaluable DDR debugging tool |
 |
| Figure 5: Shown are examples of eye diagrams of isolated portions of the DDR signal burst |
Another useful tactic is to perform analysis on the DDR bus by looking at isolated portions of the burst. For example, we might want to see an eye diagram of only the portion of the burst when the DDR signal is coming out of electrical idle. Or, conversely, perhaps we want to ignore that period of the burst and only focus on the DDR signal when it's at either its high or low values. Figure 5 shows examples of both of these scenarios.
Previous blogs in this series:
Debugging the IoT
Anatomy of an IoT Device
IoT Digital Power Management and Power Integrity
Investigating IoT Wireless Signals
Investigating IoT Wireless Signals (Part II)
Acquiring and Characterizing IoT Sensor Signals
Debugging Low-Speed Serial Data on IoT Devices
Debugging CANbus for IoT Devices
Debugging Ethernet, SATA, and PCIe for IoT Devices
Debugging DDR Memory on IoT Devices
No comments:
Post a Comment