 |
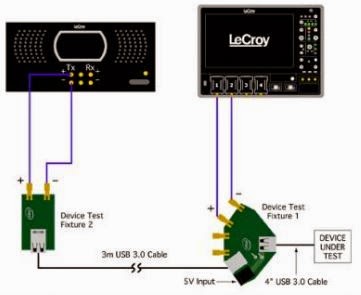
| Figure 1: A representative transmitter compliance test setup |
On the physical-layer testing side, transmitter testing is aided greatly by the availability of automated compliance-test software packages, which provide faster test procedures and a lot less complexity for the test engineer. Figure 1 shows a typical transmitter compliance test setup.
The aim of transmitter testing is to ensure that the device under test (DUT) meets the jitter tolerance requirements spelled out in the USB 3.0 specification. It's important to view USB 3.0 or 3.1 physical-layer signals on an oscilloscope, which will lay bare signal features such as overshoot, reflections, crosstalk, glitches, or other issues that will only appear as occasional error messages at the protocol level.
 |
| Figure 2: The upper trace shows a USB 3.0 data stream captured at 20 GS/s; the lower trace is a zoomed portion |
If nothing else, the upper trace tells us that the link is active and working. On Teledyne LeCroy oscilloscopes, a table (seen at lower left of Figure 2) provides a short-hand description of the captured waveform. Clicking on items of interest in that table automatically instructs the instrument to display the physical shape of that portion of the signal along with its decoded data. In this case, the zoomed detail in the lower trace shows the data packet header including address, sequence number, and endpoint number.
QualiPHY compliance test suite automates the process of verifying the DUT's conformance to applicable standards. An engineer can run QualiPHY in the lab and then bring the DUT to a USB-IF Compliance Workshop, or to an independent certified test house, and have a high degree of confidence that the device will pass. Tests include eye diagrams, characterization of the spread-spectrum clock, jitter (total, random, and deterministic), and many other physical-layer tests.
To generate eye patterns such as those shown in Figure 3, an oscilloscope acquires a long, continuous waveform and recovers the embedded clock, then slices the data at the end of each bit and displays all of the bits onscreen. Often, protocols differentiate between signal performance in the case of transition bits (shown on the right side of Figure 3) and non-transition bits (shown on the left side of Figure 3).
 |
| Figure 4: With increasing data rates comes degradation in signal integrity at the receiver |
When it comes to receiver testing, this is a procedure that was not typically required for older standards. But now that data rates have risen significantly, receiver testing is more and more prevalent as a requirement. Transmitting higher bit-rate signals over the same backplane materials translates into tighter electrical margins at the receiver, as the eye diagrams in Figure 4 demonstrate.
Receiver test typically consists of two stages. The first is calibration, an iterative process that adds precise levels of specific electrical impairments to the receiver tester's output. An oscilloscope performs analysis of the signal output's quality. The second stage is loopback testing, when the calibrated signal is applied to the DUT. The DUT retransmits the received pattern, which the receiver tester checks for errors in comparison to its own transmitted pattern.
Receiver testing is challenging for USB 3.0 links because the host (a computer, for example) and device (say a thumb drive or camera) operate with different clocks running independently of each other. The host and device transmit data with embedded skip ordered set (SKP) symbols. By injecting or removing additional SKP symbols, each side can control and match the other side's clock speed.
This poses a challenge for receiver testing because the addition and removal of SKP symbols in the data stream means that the data sent out of a bit-error rate (BER) tester is always different from data received for BER comparison. This creates a critical requirement for protocol awareness in BER testers so that SKP symbols are filtered before BER comparison.
In subsequent posts on this topic, we'll look at link-layer testing issues.

No comments:
Post a Comment