 |
| Figure 1: Bandwidth is defined as the frequency at which the ratio of the displayed amplitude to the input amplitude is -3 dB (or 0.707) |
The frequency at which the ratio of the displayed amplitude to the input amplitude is -3 dB (or 0.707).
This is known as the "-3 dB point," or the half-power point (Figure 1). At this frequency, a sine-wave input signal is attenuated to 70.7% of its true amplitude. Any higher frequencies will likely be distorted on the display, making accurate measurements and calibration impossible.
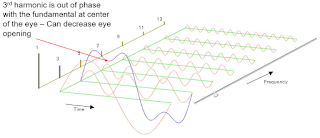
The Fourier expansion of a square wave shows why bandwidth is worth caring about. Square waves represent the summation of a fundamental frequency and an infinite number of harmonics. One can see how the shape of a square wave changes with the capture of more harmonic content. It's clear that there is a direct relationship between the frequency content and the signal's rise time (Figure 2).
 |
| Figure 3: Having enough bandwidth is key to gaining insight into the frequency content of a signal |
There is another bandwidth relationship to consider, and that's the relationship between analog bandwidth and the bit rate of the signal. As a general rule, the oscilloscope's analog bandwidth should be about 2.5X the signal's bit rate. If, for example, we're observing a 25-Gbit/s square wave, the frequency content includes a 12.5-GHz fundamental, a 37.5-GHz third harmonic, and a 62.5-GHz fifth harmonic. So in this case, depending on the power spectral density of the signal, there could be significant power present out to the fifth harmonic. Thus, we'd recommend an oscilloscope with a 65-GHz bandwidth.
We'll pick up on the topic of bandwidth in our next installment. Meanwhile, please visit the prior entries in this series of posts:
Probing Techniques and Tradeoffs (Part I)
Probing Techniques and Tradeoffs (Part II)

No comments:
Post a Comment