You need to test, we're here to help.

You need to test, we're here to help.

28 February 2022

Signal and Power Integrity Tutorial: A Robust Method for Measuring Clock Jitter with Oscilloscopes

Figure 1. Clock jitter measured as a variation of clock signal absolute period.
Figure 1. Clock jitter measured as a variation
of clock signal absolute period.
Clock jitter is the variation of a clock signal’s frequency or period. Either measurement carries the same information, but the period measurement is a simple time interval measurement easily performed using a real-time oscilloscope. If we have a robust way of measuring clock jitter, we have the basis for measuring the clock signal’s sensitivity to other features in the environment that can affect the period. Voltage noise on the power rail is just one external force that can affect clock jitter, which we'll show you how to measure in a future post.

In this post, we’ll demonstrate a robust method for measuring clock jitter using an example from Dr. Eric Bogatin’s webinar, “The Impact of Power Rail Noise on Clock Jitter.”  

The clock in our examples is a 5-stage ring oscillator which generates a square wave signal between 10 and 66 MHz. The test instrument is a WavePro HD 12-bit, 4-Ch, 8 GHz, 20 GS/s, 5 Gpts oscilloscope with 60 fs sample clock jitter.

In the process, we make a series of oscilloscope sample clock tests and timebase adjustments as  consistency checks. While measuring jitter is less about absolute accuracy than about the relative precision of measuring the time interval from cycle to cycle, a fundamental part of that is ensuring the absolute accuracy of the oscilloscope’s timebase.

21 February 2022

9 Important Things to Know When Making Sensitive Measurements with Oscilloscopes

We've routinely posted on how you can characterize your total measurement system to gain important "situational awareness" when using an oscilloscope to make sensitive measurements. The knowledge gained from these tests helps you properly interpret your measurement results so that you can deduce what is actually going on with your circuit, versus what is an artifact of the measurement system. Listed here are nine important things you should know before making sensitive measurements with your oscilloscope, with links to blog posts that instruct you how to test them.

14 February 2022

Transmission Lines for Oscilloscope Users, Part 4

Figure 1: Characteristic waveform when the source impedance is lower than the cable impedance.
Figure 1: Characteristic waveform when the source
impedance is lower than the cable impedance.
In Part 3, we saw the pattern of reflections that occur when both the source impedance and the oscilloscope input impedance are higher than that of the interconnect, and how those reflections affected the rise time measurement. Now let’s briefly consider what happens when the source impedance is lower than the impedance of the connecting cable. 

For this example, the source voltage is a 3.3 V square wave and the source impedance is 9 Ω. As before, our transmission line is a 50 Ω coaxial cable connecting the source to the oscilloscope. If the oscilloscope input termination is set to 1 MΩ, we see the interesting waveform shown in Figure 1.

07 February 2022

Transmission Lines for Oscilloscope Users, Part 3

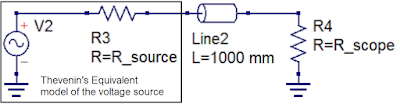
Figure 1: The Thevenin equivalent circuit model can be used to characterize a voltage source with respect to the  interconnect cable and oscilloscope input termination.
Figure 1: The Thevenin equivalent circuit model can be used
to characterize a voltage source with respect to the 
interconnect cable and oscilloscope input termination.
In Part 2, we demonstrated how to calculate the instantaneous impedance of a transmission line. However, any measurement made using an oscilloscope should consider not only the transmission line, but the source, the transmission line and the oscilloscope as a system. Therefore, characterizing your source, as well as knowing the effects of your oscilloscope input impedance, is important to developing the “situational awareness” needed to interpret measurements properly.

Two terms needed for us to characterize the source are the Thevenin source voltage and the Thevenin source resistance. Once we know these, we have all the pieces we need to fully understand what is happening with our measurements. This is true whether the signal source is a Cal terminal or a device-under-test.

31 January 2022

Transmission Lines for Oscilloscope Users, Part 2

Figure 1: A transmission line can be seen as a series of "buckets" of capacitance charged to a voltage by the signal as it "walks the line."
Figure 1: A transmission line can be seen as
a series of "buckets" of capacitance charged
to a voltage by the signal as it "walks the line."
In Part 1, we experimented with the signal rise time measurement and saw that it appeared to increase substantially as the length of the interconnecting cable was increased. To understand why, we revisited some basic principles of signal integrity:

1. All interconnects are transmission lines. 
2. Signals are dynamic, and once launched, cannot be prevented from propagating down the transmission line.

Be the Signal

To illustrate the dynamic nature of signals, imagine a very simple, 1 ns long, 50 Ω impedance transmission line. As a 1 V signal is launched into the transmission line and propagates, at each step along the way it asks "What's the impedance of the environment?" at its leading edge. That is the instantaneous impedance, notated as Z. Impedance is always defined as the ratio of a voltage to a current. We know the voltage of this signal (1 V), but how do we find the current at the edge? 

24 January 2022

Transmission Lines for Oscilloscope Users, Part 1

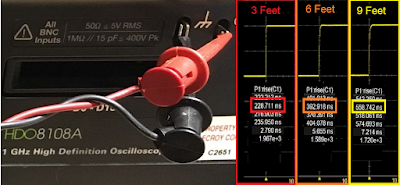
Figure 1: The rise time of the Cal signal seems to increase significantly by increasing the length of the interconnect cable. Is it true? Click image for details.
Figure 1: The rise time of the Cal signal seems to
increase significantly by increasing the length of the
interconnect cable. Is it true? Click image for details.
This post is the first of a series that will discuss what every oscilloscope user needs to know about transmission lines. It is going to introduce you to the absolutely most important signal integrity principles everybody needs to know when using an oscilloscope to measure signals with rise times shorter than 10 nanoseconds. After demonstrating some easily misinterpreted measurements, we’re going to look “under the hood” at what’s really happening to show you how it's all about the principles of transmission lines. Awhile back, Dr. Eric Bogatin offered a condensed version of What Every Oscilloscope User Needs to Know About Transmission Lines that summed up the key takeaways, but by revisiting “Transmission Lines 101” with us here, we’ll hopefully also show you a different way of thinking about your measurements.

17 January 2022

9 Quick Fixes to Improve DDR Probing

Figure 1: Reversed Handsfree mounts and chip clips help relieve strain on fragile solders.
Figure 1: Reversed Handsfree mounts and chip
clips help relieve strain on fragile solders.
Probing at DRAM pins as required by JEDEC can be challenging. Here are nine, simple ways to improve your DDR probing.

1. Use positioning tools to relieve strain on probe tips

The Handsfree probe holder included as an accessory with several Teledyne LeCroy probes, such as the WaveLink and DH Series probes, was originally designed to put weight on the probe tip to ensure a good contact. However, many DDR probing applications utilize solder-in (SI) tips, where the greater concern is to relieve strain on the tip so as to not disrupt the solder. It turns out that if you use the Handsfree in a “reverse mounted” orientation (Figure 1), it puts the amplifier in a perfect position to help relieve strain on probe tips.