 |
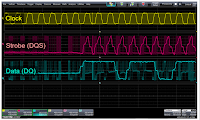
| Figure 1: VP@Rcvr builds a transmission-line model to virtually move less-than-ideal probing points |
 |
| Figure 2: LPDDR2 with reflections as shown here make accurate timing measurements difficult to obtain |
If we were to look at a typical LPDDR2 signal, we might see nice, clean transitions in some portions of the waveform. But in others, we might see something that shows evidence of reflections, as in Figure 2. For DDR memory, or any serial-data protocol, for that matter, this sort of non-monotonic behavior makes it difficult, or even impossible, to make accurate timing measurements.
 |
| Figure 3: The transmission line between a memory controller and DRAM shows reflections from an open termination |
What we're looking at is communication between a memory-interface controller and some DRAM. Between the two lies the transmission line, and let's say that in this case, the transmission line has a characteristic impedance of 50 Ω. At the DRAM, we have an open termination.
 |
| Figure 4: With VP@Rcvr, we can create a model of the transmission line and compensate for reflections |
So 822.5 ps is the round-trip time, but what we're interested in is the one-way trip time, which is 411
ps. Now that we know that we have an open termination as well as the total propagation delay, we can use VP@Rcvr to create a simple model of the transmission line. We populate these parameters into our model and we can now use VP@Rvcr to compensate for the reflection.
 |
| Figure 5: The traces at top show DQS and DQ before application of the VP@Rcvr tool; the bottom traces show the aftermath of the tool's use |
In this case, the probe was not placed at the receiver (housed in a BGA package). As a result, the reflection seen at the probe point is caused by the receiver. It would not have been seen by the receiver itself if the probe could have been placed there.
After modeling the circuit, the reflections are removed (as seen in Figure 5) and there are now clean rising and falling edges on the data and strobe lines. These signals accurately depict how the signal appears at the receiver. As a result, we've cleaned up the signal fidelity, enabling us to make accurate measurements and view the signal as it would appear if we probed at the ideal location.
Previous posts in this series:
Probing Techniques and Tradeoffs (Part I)
Probing Techniques and Tradeoffs (Part II)
Probing Techniques and Tradeoffs (Part III)
Probing Techniques and Tradeoffs (Part IV)
Probing Techniques and Tradeoffs (Part V): Probe Loading
Probing Techniques and Tradeoffs (Part VI): Dynamic Range
Probing Techniques and Tradeoffs (Part VII): More on Dynamic Range
Probing Techniques and Tradeoffs (Part VIII): Gain/Attenuation vs. Noise
Probing Techniques and Tradeoffs (Part IX): Best Practices
Probing Techniques and Tradeoffs (Part X): More Best Practices
No comments:
Post a Comment