 |
| Figure 1: Higher data rates + "same old" channel media = degraded signal quality at receiver |
To truly understand these effects on high-speed serial data links, an important tool is the ability to emulate, or de-embed, the channel itself. Consider the example of Figure 1, where we're looking at the eye diagram on the transmitter end of the channel (at left). That channel could be coaxial cable, a backplane, or some other connector. At right is the eye diagram at the receiver, where there's obviously been some signal degradation due to inter-symbol interference (ISI). The eye height and width are severely compromised.
A solid strategy for such scenarios is to simulate removal of the channel's effects by including a model in the form of a Touchstone S-parameter file. Conversely, an S-parameter representation of the channel can show you what the effects on your signal would be at a given data rate. You can embed the channel in simulations to observe the link's performance, and use the results to tweak the design to improve things.
 |
| Figure 2: S parameters describe the electrical behavior of linear passive networks, accounting for detrimental channel effects such as ISI, losses, and mismatches |
Let's take a step back and cover a couple of points about S (or scattering) parameters. S parameters describe the electrical behavior of linear passive networks. That behavior might be influenced by any of a number of factors including ISI, losses, dispersion, and impedance mismatches. The S-parameter matrix will account for all of those factors on all ports (Figure 2). With S parameters (or Touchstone-format files), we can have our oscilloscope emulate the effects of the channel or remove the channel's effects from your measurements of link performance.
 |
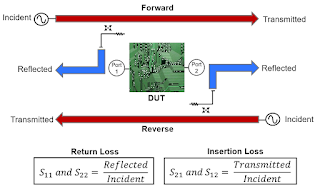
| Figure 3: Some definitions of terms surrounding S parameters and channel losses |
If impedance matching is very good, there won't be much reflected signal. In such cases, S11 and S22 will be very small values. In terms of decibels, they would carry a large negative value, perhaps on the order of -50 or -60 dB.
Nominally, we would expect insertion loss to be 0 dB, which would mean that all of the signal that leaves the transmitter reaches the receiver. But in the real world, this never happens. Going higher in frequency results in higher insertion losses.
Our next post will take a closer look at continuous time linear equalization.
Previous posts in this series:
Introduction to Debugging High-Speed Serial Links
A Look at Transmission-Line Losses
How Much Transmission-Line Loss is Too Much?
Inter-Symbol Interference (or Leaky Bits)
Rise-Time Degradation and ISI Jitter
Introduction to Channel Equalization
The Effects of De-Emphasis on Eye Diagrams
No comments:
Post a Comment