You need to test, we're here to help.

You need to test, we're here to help.

25 July 2022

Signal and Power Integrity Tutorial: How PDN Design Affects Board-level Noise

Figure 1. Oscilloscope traces resulting from  measuring a 3.3. V power rail with a 10x probe versus a coaxial connection, with an adjacent 10x probe acting as an RF antenna.
Figure 1. Oscilloscope traces resulting from 
measuring a 3.3. V power rail with a 10x probe
versus a coaxial connection, with an
adjacent 10x probe acting as an RF antenna.
By Prof. Eric Bogatin,
Teledyne LeCroy Fellow

Excerpted by permission from the Signal Integrity Journal article, Measuring Only Board-level Power Rail Noise May Be Misleading

In our blog, we’ve presented a lot about the impact of the interconnect on oscilloscope measurements, and how where you probe can be as important as how you probe. This article is an excellent demonstration of those very principles.

************************************

Power rail measurements are important because they can identify potential sources of noise before they become a problem. However, measuring only the power rail noise at the board-level may be a misleading indication of the noise the die actually sees. 

Best Practices for Power Integrity Measurements

Measuring a power rail on a board seems like a simple task. Like all measurements, it is easy to get a waveform on the oscilloscope’s screen, but it is difficult to have confidence you have eliminated the measurement artifacts and have a realistic measure of the actual signal present.

18 July 2022

Six Principles of FFT Analysis Using Real-time Oscilloscopes

Figure 1. A 100 MHz sine wave in the time domain and its spectrum in the frequency domain showing the one peak at 100 MHz.
Figure 1. A 100 MHz sine wave in the time domain
and its spectrum in the frequency domain showing
the one peak at 100 MHz. Click on any image to enlarge.
By Prof. Eric Bogatin,
Teledyne LeCroy Fellow

The following piece was published in Signal Integrity Journal and is excerpted here by permission of Signal Integrity Journal.

***************************

We live in the time domain. This is where we measure all digital performance. But sometimes, we can get to an answer faster by taking a detour through the frequency domain. With these six principles, we can understand how an oscilloscope transforms time domain measurements into a frequency domain view. All six principles are applied “under the hood” by oscilloscopes with a built-in FFT function. (Our note: Also by software packages designed for spectral analysis, such as the SPECTRUM-1 and SPECTRUM-PRO-2R options.)

1. The spectrum is a combination of sine wave components

In the frequency domain, the only waveforms we are allowed to consider are sine waves. There are other special waveforms combinations of which can describe any time-domain waveform, such as Legendre polynomials, Hermite polynomials or even wavelets. The reason we single out sine waves for a frequency domain description, is that sine waves are solutions to second order, linear, differential equations—the equations found so often in electrical circuits involving resistor, capacitor and inductor elements. This means signals that arise or have interacted with RLC circuits are described more simply when using combinations of sine waves than any other function because sine waves naturally occur. 

05 July 2022

A Tale of Two Calibrations: Vector Network Analyzer vs. WavePulser 40iX

Figure 1: This sequence diagram of the classic SOLT 2-path calibration shows the order of connections required.
Figure 1: This sequence diagram of the
classic SOLT 2-path calibration shows
the order of connections required. 
It was the best of S-parameter measurements, it was the worst of S-parameter measurements…and the difference was in the calibration.  Calibrating a vector network analyzer (VNA) before making any measurements is required in order to reduce errors from imperfect channel matching, less than optimal directivity in the directional couplers and cable response issues. While VNAs are precisely calibrated at the factory, that calibration only extends to the front panel measurement ports. There will inevitably be drift on the internal paths over time. Also, any cables, adaptors or fixtures connected to the measurement ports must be characterized and de-embedded in order to make exact measurements of the device under test (DUT).  

There are many possible calibration methods depending on the number of ports and paths being measured.  For simplicity, let’s consider the common 2-port, 2-path calibration.  This calibration method will yield a full set of S-parameters for the two ports: S11, S12, S21 and S22.  It requires the use of a short, open, load and through (SOLT) calibration reference standard, along with the cables used in the test setup, as shown in Figure 1.

27 June 2022

Get Ready for PCIe 6.0 Base Tx Testing--Compliance, Jitter and Eye Diagrams

Figure 1. The four levels and three eyes of the PCIe 6.0 PAM4 signal. Click on any image to enlarge.
Figure 1. The four levels and three eyes of the
PCIe 6.0 PAM4 signal.
Click on any image to enlarge.
The PCI Express® 6.0 Base specification was officially released in January 2022 at version 1.0, meaning it is considered final. The CEM and PHY test specifications are currently at version 0.3, and 0.5 versions of both will probably be released sometime in the third or fourth quarter of 2022. As both the CEM and PHY test specifications are still at an early stage, it's hard to predict exactly when the PCIe® 6.0 compliance test program will start, but it's safe to say it is at least a few years out. However, PCIe 6.0 Base testing is upon us, especially those of us working on chip design.

So, what can implementers expect as they retool for PCIe 6.0 Base Tx and Base Rx physical layer testing?

20 June 2022

Is It OK to Use an External 50 Ohm Terminator with an Oscilloscope?

Recently, a reader posed the question in the Comment field on Dr. Eric Bogatin's blog post, How to Choose Between the Oscilloscope's 50 Ohm Input and 1 MOhm Input:  "Is there any difference between using an external 50 Ohm terminator instead of the internal 50 Ohm termination on the oscilloscope--for example, using a RG58/RG174 cable?"

Eric answered:

"In principle, you can use the oscilloscope input set for 1 MOhm termination, then add an external 50 Ohm termination resistor on a BNC Tee connector, for example. This has the advantage that you can actually use any resistor for a load, or terminate signals with an RMS voltage larger than 5 V.

However, there are two problems with using this approach for high-speed signals with rise times shorter than 1 nsec, which require an oscilloscope with bandwidth larger than 1 GHz.

13 June 2022

Oscilloscope Basics: Cal Out and Aux Out

Figure 5. New PCIe 6.0 compliance pattern signal.
Fig. 1: Cal Out and Aux Out 
provide many useful outputs.
Oscilloscopes are generally thought of in terms of the signals that are input to them, but even oscilloscopes that are not equipped with function/signal generators can usually output some useful test signals.

Nearly all oscilloscopes have a Cal Out (calibration output) terminal on the front. Most Teledyne LeCroy oscilloscopes also have an Aux Out (auxiliary output) connector on either the front or back, depending on  model. Both outputs provide configurable signals that can assist you to compensate probes and attenuators, test frequency response, trigger waveform acquisition and coordinate multiple test instruments.

06 June 2022

What Happens When You Connect a USB-C Cable

The USB Type-C® connector is designed to be very simple for the user to use: you insert it in either orientation, and a multitude of services just “work”. Though simple to use, it is a complicated connector to program and test, with a very complex system of protocols behind it. There is USB power delivery (USB-PD) and multiple rates of USB data delivery from USB 2.0 through USB4®, specified by the USB Implementers Forum (USB-IF®). There are protocols other than USB, such as DisplayPort™, High-Definition Multimedia Interface (HDMI™), Peripheral Component Interconnect Express (PCIe®), Base-T Ethernet and Thunderbolt™. 

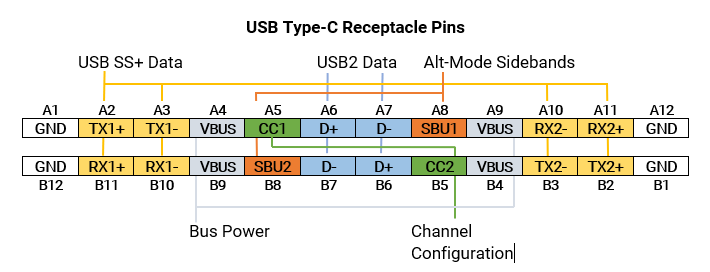
So, what actually happens when you connect a USB-C cable? To understand that, first let’s take a look at the signals and pin assignments in the USB-C connector receptacle (Figure 1).

Figure 1: The USB-C receptacle pin assignments showing the key signals used for device-to-device communications. Related pins have matching color overlays.

Figure 1: The USB-C receptacle pin assignments showing the key signals used for device-to-device communications. Related pins have matching color overlays.