 |
| Figure 1: In the frequency domain (right), a near-ideal square wave displays predictable 1/f amplitude dropoff |
Another way to look at and/or think of this relationship is in terms of some periodic waveforms, all of which have the same repeat frequency, and the spectra comprising them. At left in Figure 1 is a near-ideal square wave in the time domain, while at right is the same square wave in the frequency domain. As we might expect, the drop offs in amplitude occur in a fashion mirroring what we would predict by hand, almost literally following A = 2/πn.
 |
| Figure 2: A longer rise time means decreased bandwidth |
 |
| Figure 3: With a distorted waveform, all bets are off |
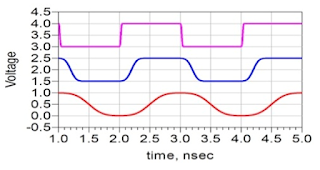
What if we want to determine the bandwidth of a signal for which we don't know the rise time, but we do know the clock frequency? Figure 4 depicts three different clock signals, all with the same frequency but with different rise times. What can we surmise about the bandwidths of these signals?
 |
| Figure 4: Same frequencies, different rise times, but what are the bandwidths? |
To arrive at a bandwidth estimation from a clock frequency, we have to make an assumption about the rise time as a percentage of the waveform's period. If we use, say, 7% as our rise-time assumption, we can use a little algebra as follows:
Thus, we arrive at the oft-cited rule of thumb that says bandwidth equals 5X the clock frequency.
We can think about bandwidth as a property of a signal, but when it comes to an oscilloscope, we are talking about the bandwidth of the instrument. Bandwidth is a critical figure of merit for oscilloscopes.
 |
| Figure 5: This graph compares the frequency response of an RC filter with that of an oscilloscope |
Sure enough, we find that the 10-90% rise time = 0.35/BW3 dB. Thus, using the term "bandwidth" to mean the -3 dB point for the single-pole filter, the relationship holds.
For the oscilloscope, the transfer function is a little different from that of the single-pole filter. The oscilloscope's red curve in Figure 5 rides higher than that of the single-pole filter, until it falls off a cliff. If we still use the -3 dB point as our definition of bandwidth for the oscilloscope, the relationship of rise time to bandwidth is a little different for a multi-pole response; it's 10-90% RT = 0.45/BW3 dB. But still, if we know the bandwidth of the oscilloscope, then we can determine the shortest rise time we'll be able to observe with it. If, for example, your oscilloscope is rated for a 1-GHz bandwidth, that shortest rise time will be about 450 ps.
Armed with the background information from this post and the preceding one, next time we can begin applying it to transmission lines.
Previous posts in this series:
Transmission Lines (Part I): Introduction
No comments:
Post a Comment