 |
| Figure 1: Characterization of an ESD pulse's rise time depends largely on the oscilloscope's sampling rate |
Figure 1 illustrates four acquisitions of the same signal, each at a different sample rate. On the left are the pulse waveforms themselves, and on the right are zoom traces of each pulse.
The top trace, sampled at 40 GS/s, yields about 50 sample points on the rising edge, which makes for a good edge characterization. The other three traces, at 4 GS/s, 2 GS/s, and 1 GS/s, respectively, provide fewer and fewer sample points on the rising edge. We can see that the 1-GS/s trace is quite inadequate for edge characterization.
 |
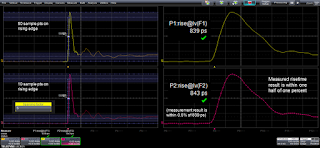
| Figure 2: As a rule of thumb, capture at least 10 sample points on the rising edge of an ESD pulse for an accurate rise time |
A good rule of thumb is to acquire at least 10 sample points on the rising edge of an ESD pulse. Referring to Figure 2, the trace at upper left with 50 sample points on the rising edge yielded a very accurate rise-time measurement of 839 ps as noted above. The trace at lower left, taken at a sampling rate of 4 GS/s, provided 10 sampling points on the rising edge and a rise-time measurement of 843 ps, which is within 0.5% of actual. The traces on the right are zoom traces showing the sample points.
So a good approach is to start with the oscilloscope at its maximum sampling rate and to reduce that rate until you have about 10 sample points on the rising edge. That will optimize your use of acquisition memory and sampling rate to achieve an accurate rise-time characterization of your ESD pulse.
No comments:
Post a Comment