 |
| Figure 1: A probe's impedance varies with frequency |
Ideally, an oscilloscope probe would transfer the signal from a circuit to an oscilloscope's input with perfect fidelity. The probe would present zero attenuation, infinite bandwidth, and linear phase characteristics at all frequencies from DC to light.
 |
| Figure 2: A general-purpose passive probe can be seen as an input capacitor in parallel with an input resistance, while its ground lead represents a series inductor |
From the perspective of the DUT, the probe represents a load with some amount of resistance,
capacitance, and inductance. Figure 1 depicts a representative plot of impedance magnitude vs. frequency. Note that there's a reasonably flat response at DC, but an increase in frequency brings a decrease in impedance magnitude. Ideally, we want to keep the impedance magnitude as high as possible, but the reality is that the probe's effective R, L, and C cannot help but impact the DUT.
 |
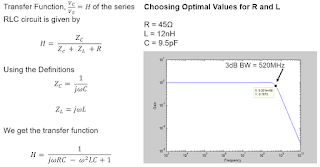
| Figure 3: A probe's frequency response can be optimized by calculating optimal R and L values using the reactance definitions and transfer function shown here |
At left in Figure 2, we can model the target as a voltage source with a series resistance. When we connect the probe to the target, we begin drawing some energy from the circuit. In this case, with the probe's input resistance of 10 MΩ, the voltage drop we would be measuring would be across the probe's input capacitance.
 |
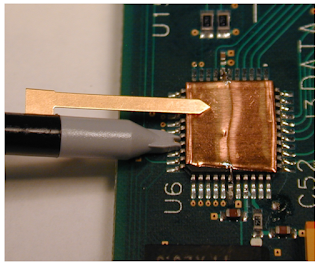
| Figure 4: A low ground blade configuration for a ground lead can extend frequency response to beyond 520 MHz |
What are some of the ways in which one can improve the loading situation? A critical aspect is the inductance of the ground lead, so using a configuration as shown in Figure 4 can help minimize that inductance. A low ground blade of this nature offers an inductance of 10 to 20 nH, which in turn extends the passive probe's frequency response to 520 MHz and higher.
The rectangle of copper foil mounted above the chip being probed is terminated to one of the ground pins on the IC, which results in a very short ground loop. In addition, an isolating capacitor on the probe tip provides electrical isolation between test points to eliminate the risk of shorting our intended test point to any adjacent pins on the IC.
What about a not-so-ideal probe frequency response? In many cases, the probe's return path comprises an alligator clip at the end of a relatively long lead. Using the general rule of thumb of 20 nH/inch, you can end up with a ground-loop inductance of around 200 nH. Assuming the R and C values remain consistent with the ideal example of Figure 3, the plot of impedance magnitude vs. frequency shows that the -3 dB point is reduced to about 176 MHz (Figure 5). Moreover, we see a resonant peak at about 125 MHz thanks to the very large inductance imposed by the alligator lead, and we still have about 40% error at only 65 MHz.
These examples show that we must consider everything that comes with having a ground loop and a ground termination using long leads. The resulting resonant peak behavior and lessened frequency response plays havoc with our probe's performance.
Our next installment will continue examining probe loading. Meanwhile, please visit the prior entries in this series of posts:
Probing Techniques and Tradeoffs (Part I)
Probing Techniques and Tradeoffs (Part II)
Probing Techniques and Tradeoffs (Part III)
Probing Techniques and Tradeoffs (Part IV)

No comments:
Post a Comment