
 |
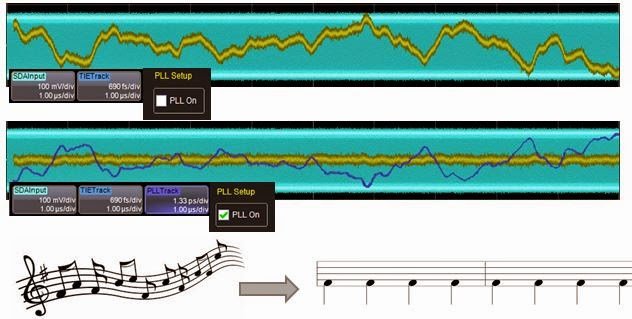
| Figure 1: Applying PLLs for clock-data recovery is not unlike tapping your feet to the beat of music |
28 May 2015
The History of Jitter (Part V)

19 May 2015
The History of Jitter (Part IV)
 |
| Figure 1: An example of a time-interval error track |
07 May 2015
Using Histograms (Part IV)
 |
Figure 1: A histogram of delay between traces C1 and C2
with an unknown event occuring 2.5 ns outside of
expected range
|
15 April 2015
Testing Challenges in Motor Drive Systems (Part II)
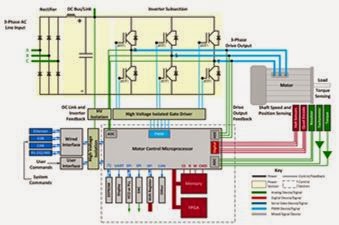 |
| Figure 1: This image depicts the complete design and debug challenge posed by a variable-frequency motor drive |
07 April 2015
Testing Challenges in Motor Drive Systems
 |
| Figure 1: The power section of a motor drive system requires measurements of line input, PWM output, and efficiencies |
02 April 2015
The History of Jitter (Part III)
 |
Figure 1: Latching a signal at the outermost of the blue
hash marks results in a BER of 10-3, while latching it
at the innermost hash marks yields a BER of 10-12
|
27 March 2015
Oscilloscope Basics: Choosing an Oscilloscope
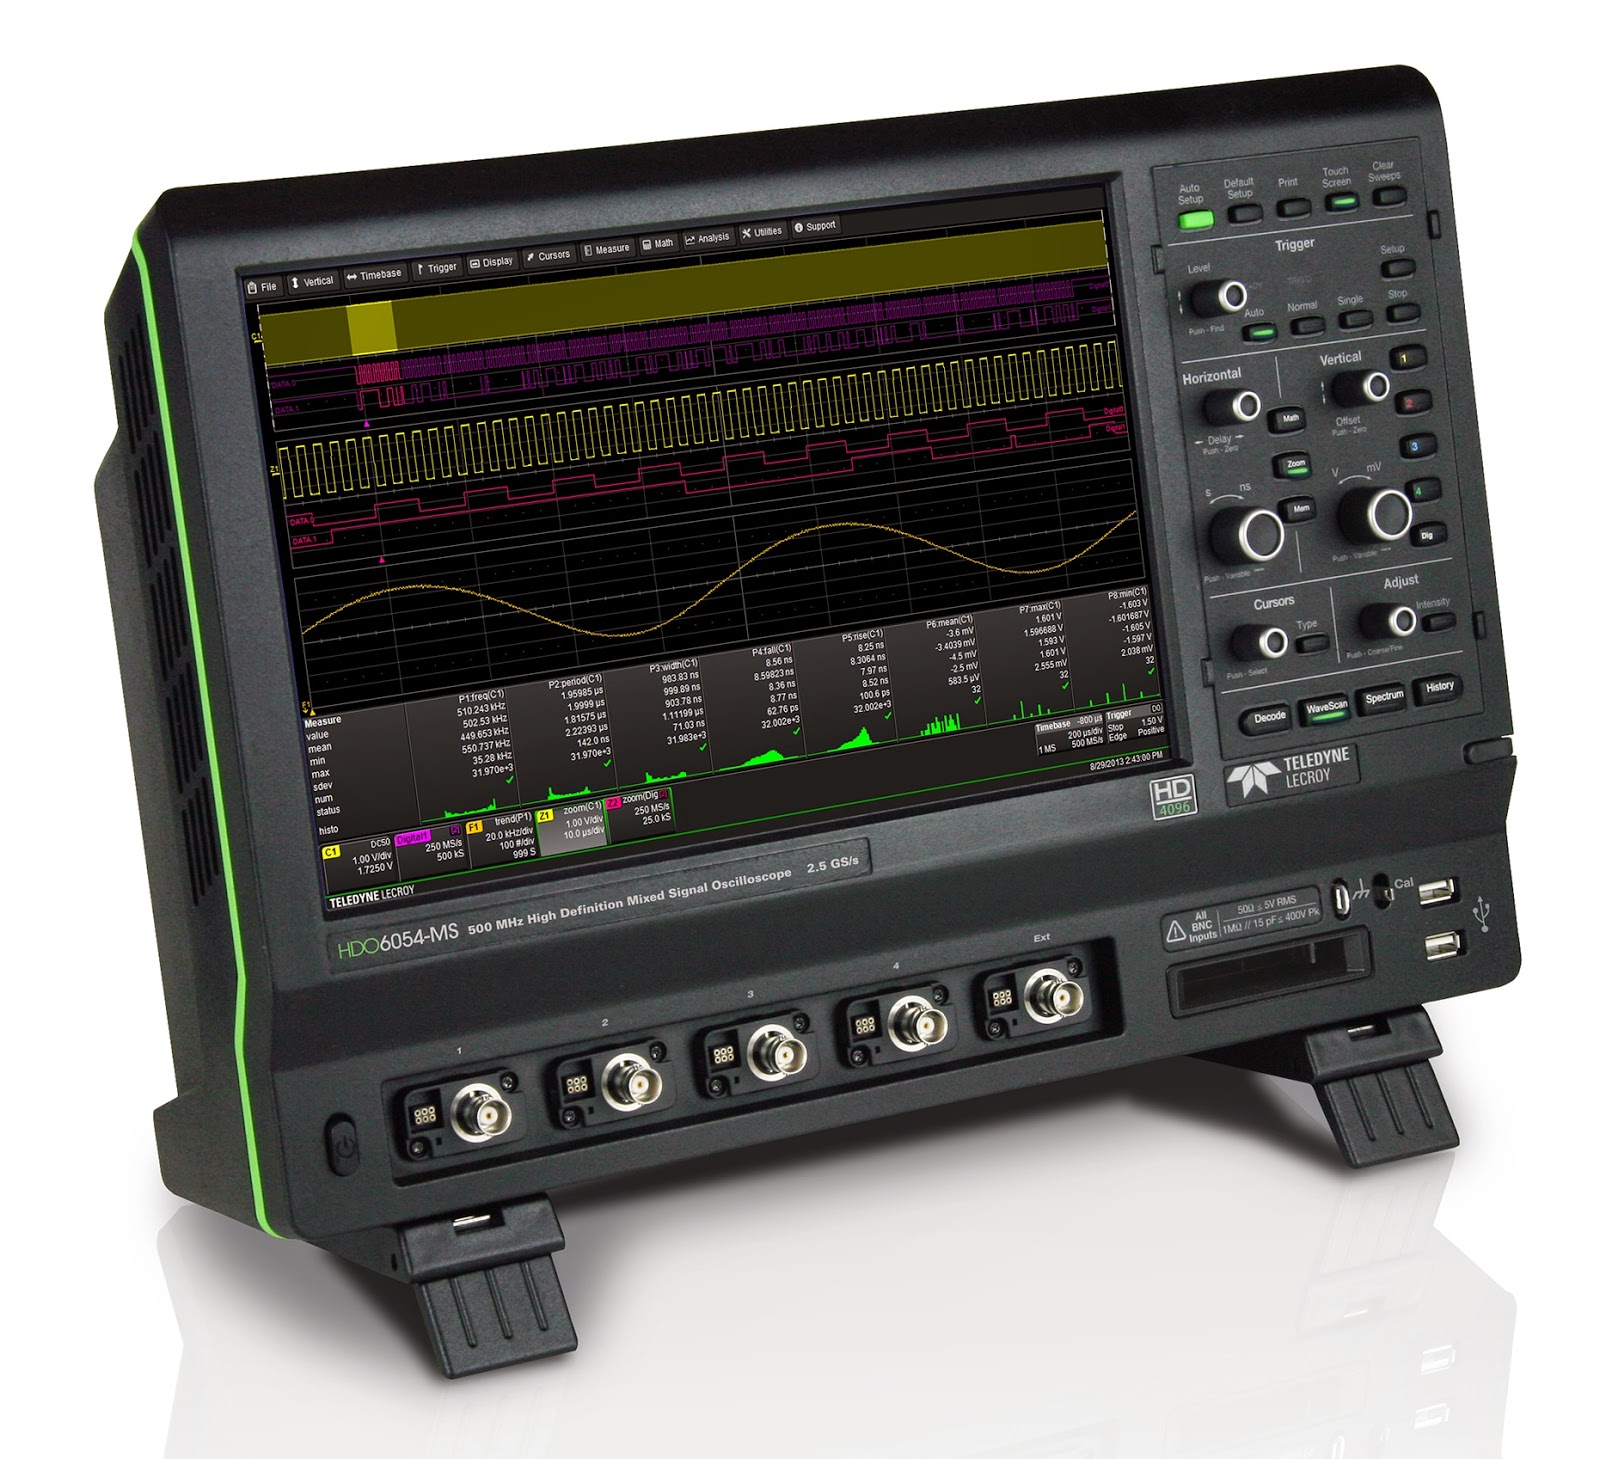 |
| Figure 1: An oscilloscope such as Teledyne LeCroy's HDO6054-MS serves a very broad range of applications |
Subscribe to:
Posts (Atom)