You need to test, we're here to help.

You need to test, we're here to help.
Showing posts with label statistical analysis. Show all posts

01 November 2021

Finding Intermittent Events

Figure 1: Statistics for 1261 Width measurements taken over 97 acquisitions on the Measure table. Width statistics can help determine the set up of a Glitch SmartTrigger.
Figure 1: Statistics for 1261 Width measurements
taken over 97 acquisitions on the Measure table.
Width statistics can help determine the set up
of a Glitch SmartTrigger.
Glitches, dropouts, runts, aperiodicity, missed cycles, slow edges—whatever you call them, they are irregular waveform elements that can wreak havoc with you circuit operation. Because they do not occur with regularity, they can be hard to find and correlate with whatever synchronous events may be causing them. How can you use your oscilloscope to easily find intermittent events where they occur? The answer is by judicious application of the oscilloscope’s measurement statistics and SmartTriggers®.

25 October 2021

Measuring Dead Time in 48 V Power Converters, Part 2: Dynamic Measurements

Figure 1. P1 and P2 measure dt@lvl over the entire acquisition, while P3 and P4 measure dt@lvl for only a single operational cycle of zoom traces Z1 and Z3.
Figure 1. P1 and P2 measure dt@lvl over the entire acquisition,
while P3 and P4 measure dt@lvl for only a single operational
cycle of zoom traces Z1 and Z3.
A primary engineering task for 48 Volt power conversion systems using bridge topologies is to ensure adequate dead time to prevent catastrophic shoot through occurring when both HI and LO FETs conduct at the same time. Being able to accurately measure dead time is therefore of critical importance. Part 1 of this series dealt with the basic dead time measurement. Part 2 will deal with studying the dynamic changes in the dead time measurement using statistical tools like tracks and histogram functions. 

As we learned in part 1, the dead time delay is measured using two instances of the measurement parameter Delta Time at Level (dt@lvl) as shown in Figure 1. 

In the Figure 1, the dt@lvl parameters P1 and P2 show the value of the last measurement in the acquisition which contains 10,000 switching transitions. The parameters P2 and P4 measure only the single timing cycle shown in the zoom traces. (Click any  image to enlarge it and see the detail.)

The values of both parameters are different, and you should ask the question: how does dt@lvl vary with time? To find the answer, turn on the measurement parameter statistics, as shown in Figure 2.

04 May 2018

Debugging Low-Speed Serial Data on IoT Devices

Serial-data links handle traffic between ICs and peripheral devices in the IoT world
Figure 1: Serial-data links handle traffic between ICs
and peripheral devices in the IoT world
Our last post discussed the difficulties in acquiring the many sensor signals that may be input to a deeply embedded system such as an IoT device as well as a hardware solution to the problem. Another aspect of IoT debugging and validation is the low-speed serial data standards used to facilitate communication between ICs and between controllers and peripheral devices (Figure 1). To that end, let's take a look at three such low-speed standards: I2C, SPI, and UART.

12 July 2017

The Periodic Table of Oscilloscope Tools: Measure

Measure tools are at the heart of an oscilloscope's utility
Figure 1: Measure
tools are at the heart
of an oscilloscope's
utility
An oscilloscope is only as good as the tools it provides to users for acquiring, viewing, measuring, analyzing, and documenting waveforms. We present an overview of our deep collection of oscilloscope tools in our Periodic Table of Oscilloscope Tools, and in prior Test Happens posts, we've surveyed the Capture and View categories. Today we'll break down the Measure section of the Table.

07 May 2015

Using Histograms (Part IV)

Figure 1: A histogram of delay between traces C1 and C2 with an unknown event occuring 2.5 ns outside of expected range
Figure 1: A histogram of delay between traces C1 and C2
with an unknown event occuring 2.5 ns outside of
expected range
In previous posts on the topic of histograms, we've considered examples of how looking at signals in the statistical domain in addition to the time and frequency domains can be a great aid in pinning down the root cause of problems. But what about going in the other direction? Suppose you spot something unusual in a histogram and want to examine the waveform?

20 March 2015

Using Histograms (Part III)
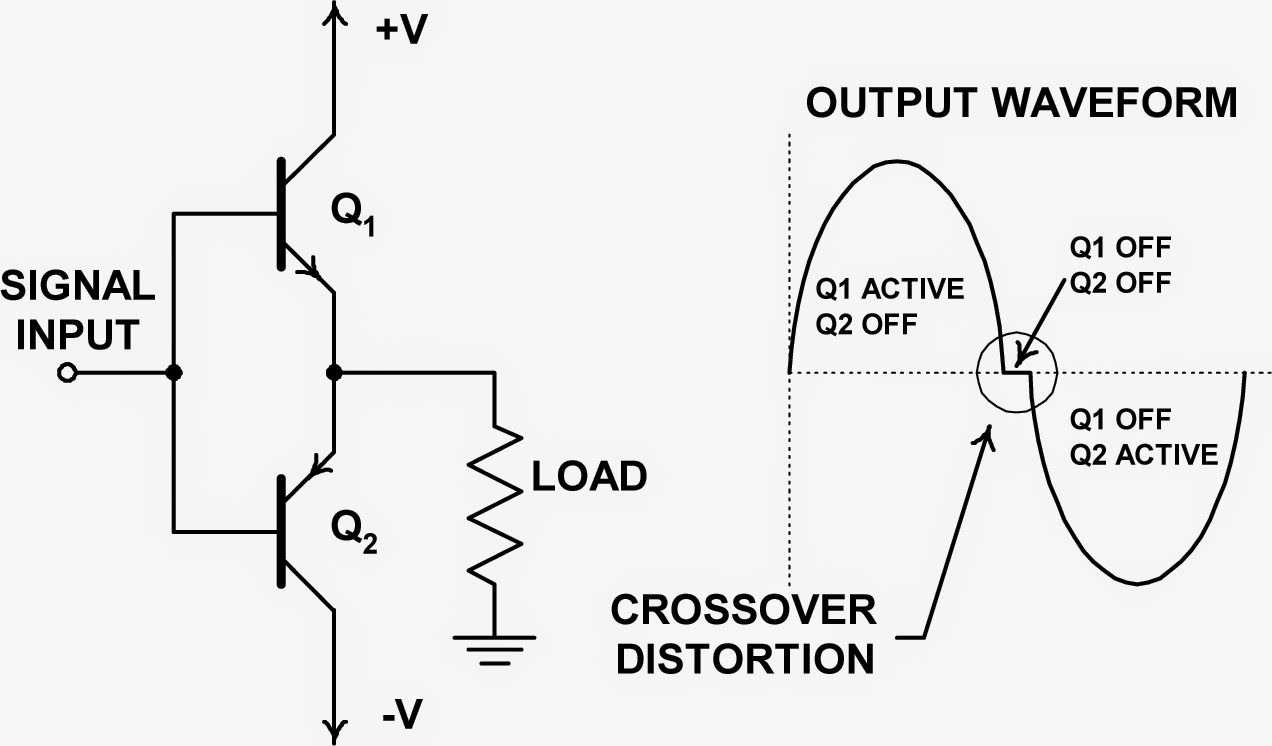
A simplified view of a push-pull amplifier showing the source of crossover distortion
Figure 1: A simplified view of a push-pull amplifier
showing the source of crossover distortion
In this third post in a series on using an oscilloscope's histogram capabilities, let's take a look at using histograms as a diagnostic tool. Diagnosing problems in a circuit calls for good skills and some intuition on top of good measurement tool. In general, though, the more ways in which you're able to look at a problem, the more likely it is that you'll turn up the root cause.

27 February 2015

Using Histograms (Part II)
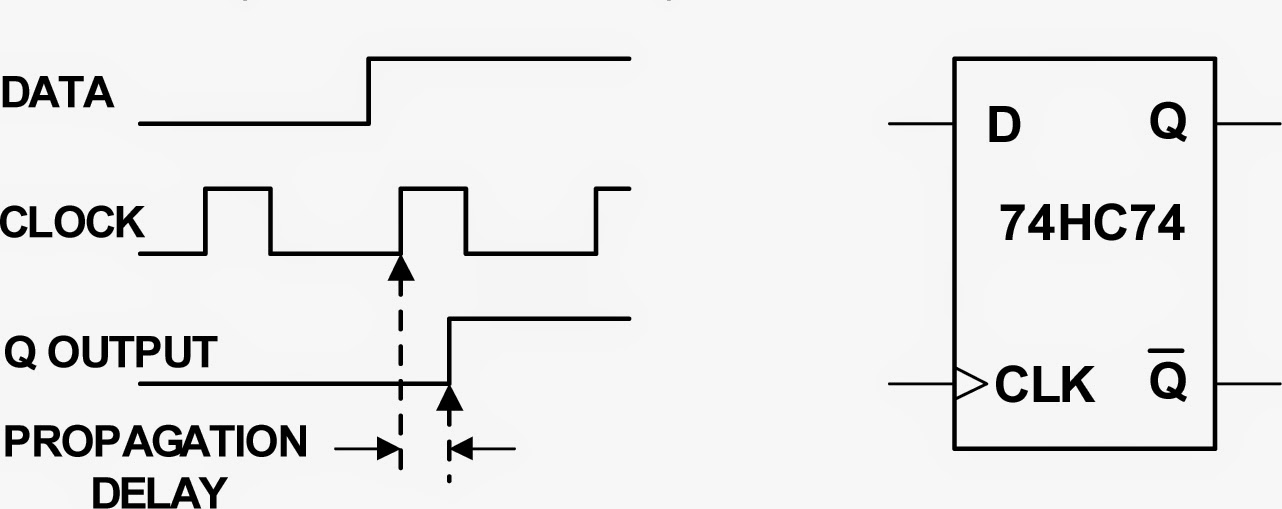
Figure 1: A flip-flop's propagation delay is a typical spec that can be derived using statistical analysis
Figure 1: A flip-flop's propagation delay is a typical spec
that can be derived using statistical analysis
In Part I of this series, we looked at some of the basics of histograms and how they can provide a statistical view into random variation of signal parameters. Next, let's look at how histograms can help us use statistical analysis to determine product specifications.

09 February 2015

Using Histograms (Part I)

Figure 1: Histograms of the period, width, and TIE show different distributions of time jitter
Figure 1: Histograms of the period, width, and
TIE show different distributions of time jitter
When we measure parameters of a waveform in a circuit or device, we rarely take a single measurement but rather a significant number of measurements. We want to see trends over time in the period, width, and time-interval error of a clock pulse, for example. Those parameters will have some nominal value, but there will typically be some random variation that we refer to as jitter.