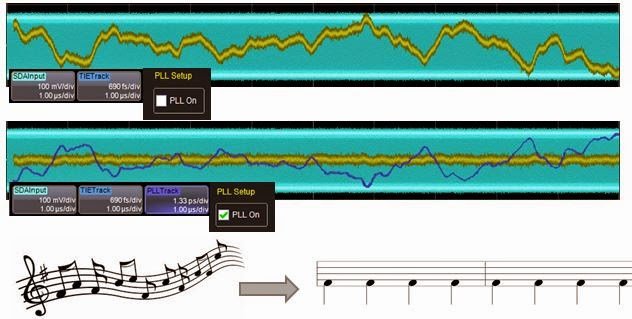
 |
Figure 1: Applying PLLs for clock-data recovery is not
unlike tapping your feet to the beat of music |
A milestone in the history of jitter measurement came in the 1990s with receivers that could reveal the slowly varying component of jitter that became evident in time-interval error (TIE) tracks. That led to the advent of using phase-locked loops (PLLs) for clock-data recovery. In turn, PLLs opened new horizons in jitter analysis.
Using PLLs for clock-data recovery was key to analysis of bit streams such as USB, in which there is only data and no clock. The idea was to find the bit rate sans clock and track it in a fashion analogous to how we tap our feet to music to track the beat.
 |
Figure 2: On the left is a full TIE histogram,
while on the right is a TIE histogram
from which data-dependent jitter
has been stripped away |
The next step was a return to the exercise of tail-fitting. Before you can fit the tails, you must know the sigma of the random jitter component. Here is where a combination of pattern detection and pattern averaging helps to strip away data-dependent jitter. With signal integrity issues such as inter-symbol interference (ISI) playing havoc with your eye diagrams, you get jitter distributions that look like that of the left side of Figure 2. Would you rather try to fit tails to Gaussians for that distribution, or would you rather start from the much cleaner distribution shown on the right?
 |
Figure 3: Using FFT to find peaks
in a random jitter TIE track |
Pattern detection enables the oscilloscope to discern patterns in a signal, which led to algorithms to create TIE tracks for random jitter and bounded uncorrelated jitter. From there, we could now look at spectral (FFT) analysis of the TIE track to gain deeper understanding of the periodic jitter components. From very long waveforms, we could now discover the peaks in the jitter distribution (Figure 3).
 |
Figure 4: With peaks removed, integrate
the noise floor to find the sigma
of the Gaussian distribution |
Thus, the history of jitter involves peak-finding algorithms, which are not easy to come by. In the early days, some of these algorithms were proprietary but now they're fairly ubiquitous and can even be found in your local Matlab toolkit. Once we find the peaks and strip them away, you're left with something that can be integrated and associated with the Gaussian random distribution. The sigma of that distribution is essentially the integral of what's under that spectrum (Figure 4).
With the dawn of the 2000s, signal integrity issues came to the forefront. The problem had shifted: How do we transmit NRZ data with growing bit rates through FR4 PCB material, which was never designed for such applications? Starting at an easy 2.5-Gb/s rate, there is very little signal attenuation at a fundamental frequency of 1.25 GHz. But by the time the bit rate gets to 5 Gb/s or higher, attenuation is significant.
 |
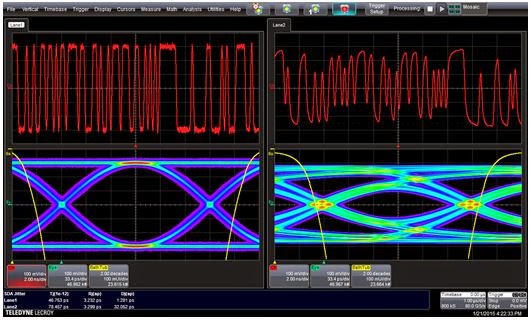
Figure 5: A 5-Gb/s bit stream before
an FR4 channel (left) and after the
same channel (right) |
We can see this in a screen capture of a 5-Gb/s bit stream (Figure 5). On the left is the eye diagram of the signal before the channel, while on the right we see the same signal after the channel. There is obvious degradation, with the eye collapsing significantly in the post-channel view.
The answer to this problem, of course, was equalization, which we began using to compensate for increased jitter due to frequency-dependent losses and ISI. We'll examine how equalization comes into the picture in the next installment of our history of jitter.


No comments:
Post a Comment