You need to test, we're here to help.

You need to test, we're here to help.

11 April 2022

Setting Up Your Oscilloscope for ESD Pulse Testing

Figure 1: An ESD calibration test setup.  The ESD gun discharges its waveform into a properly attenuated current target.
Figure 1: An ESD calibration test setup. 
The ESD gun discharges its waveform
into a properly attenuated current target. 
Electrostatic discharge (ESD) pulse tests are a type of conducted immunity testing done to confirm that a device can withstand a sudden transient electrostatic discharge. It is done by using an ESD gun to shoot a pulse of the required voltage at a device while testing that the DUT continues to operate properly. The ESD pulse shape simulates a person, carrying a static charge, touching a device. When their fingertip first touches the device, there is a leading edge with a high peak and fast decay, often visible in the real world as a spark flying from the fingertip. This is followed by a second edge due to the charge in the rest of the human body that propagates toward the fingertip with a time delay.

Oscilloscopes are most often used to “test the tester” in ESD pulse test setups, confirming that the pulse from the ESD gun is the right shape and meets the requirements of the standard to which the device is being tested. A typical calibration test setup is shown in Figure 1. The pulse from the ESD gun is fired directly into a current shunt target connected to the oscilloscope through an attenuator required to keep the signal within the limits of the oscilloscope’s 50 Ω input, which is used for this testing. Then, key parameters of the ESD pulse are measured per one of several standards, such as IEC 61000-4-2.  

ESD standards require a range of measurements. The most common are the initial edge 10% to 90% rise time, peak amplitude, pulse width, amplitude and current levels at specified times from the initial edge (e.g., T1 and T2), and time to half value. 

Following are four, important things to do to make sure you get the best ESD pulse measurements from your oscilloscope.

04 April 2022

Oscilloscope Basics: When to Use Trend to Graph Oscilloscope Measurements

Figure 1: Applying the Trend operator to the same input waveform illustrates how the Trend is asynchronous to the input waveform.
Figure 1: Applying the Trend operator to the
same input waveform illustrates how the
Trend is asynchronous to the input waveform.  
In a previous post, we described the characteristics of the Track math function and two key applications of using Tracks to graph oscilloscope measurement data: anomaly detection and waveform demodulation. In this post, we'll discuss the characteristics and uses of the Trend function.

To illustrate an important distinction between Tracks and Trends, the Trend math operator in Figure 1 is now applied to the same signal as was the Track in our previous post without first reacquiring the input waveform. 

Note that unlike a Track, the Trend is not time-synchronized to the input waveform. Only the order of events, and not the timing of events, is retained. The underlying shape of the Track may be displayed in the Trend because the same measurement values from a single acquisition are displayed in the same sequence—however, the timing information of when each of the values has occurred is not retained in the Trend. Therefore, unlike the Track, the Trend does not point to the location of an anomaly. Without time scaling, the Trend does not have the frequency information needed to demodulate an input waveform.

28 March 2022

Oscilloscope Basics: When to Use Track to Graph Oscilloscope Measurements

Figure 4: The Trend (green) retains a history of pulse widths, while the Track (blue) shows only a flat line corresponding to the most recent width.
Figure 1: Pulse Width Modulated waveform (yellow)
and Track math operator (blue),
where the X-axis scaling is identical for both.
Modern oscilloscopes contain many tools that can be used for analyzing data, including Track and Trend math functions. Both Tracks and Trends graphically display measurement results and locate anomalies. The main similarity between Tracks and Trends is that the Y-axis of both operators is the measurement parameter itself (for example, Pulse Width, Duty Cycle, Rise Time, Slew Rate, etc.). The main difference between the two math operators is their X-axis, in which the Track uses the identical X-axis and synchronous horizontal scaling as the input waveform, whereas the Trend uses units of chronology. A Track, in essence, is a waveform of the measurement values. A Trend is a data logger showing the history of change in measured parameter values, but points are not necessarily synchronous with the measured waveform.

Use Tracks for Anomaly Detection

The Track provides valuable debugging information by directly pointing to an area of interest. 

Notice the negative-going spike in the Track waveform in Figure 1. Figure 1 occurs at the point in time where the input waveform reaches its most narrow pulse width, and the Track instantly finds it, indicating when one measurement deviates from the others in the graph. The Track identifies the exact location in time where the narrowest or widest pulse width has occurred, and fully describes the measurement changes occurring throughout the entire waveform. Since oscilloscopes can acquire thousands or even millions of waveform edges within a single acquisition, the Track allows an engineer to quickly "find the needle in a haystack".

21 March 2022

PCI Express 4.0 Error Detection Using a BERT and Oscilloscope

Figure 1: BERT and Oscilloscope connection for PCI Express 4.0 error detection.
Figure 1: BERT and Oscilloscope connection
for PCI Express 4.0 error detection.
The PCI Express® 4.0 standard specification requires an oscilloscope with at least 25 GHz analog bandwidth and a BERT which can test bit rates of at least 16 Gbps. The BERT provides a known input pattern to the PCIe® device under test (DUT), and the DUT is instructed to regenerate the identical bit pattern while placed in loopback mode. Since a BERT can output a signal when a bit error is detected, this signal can be input to the oscilloscope to trigger a synchronized capture when an error occurs. By combining the capabilities of these two instruments, a powerful combination of real-time error detection and characterization can emerge.

Connecting the Instruments

In Figure 1, a known pattern is connected from the BERT PPG D1 output to the PCIe DUT input via a 2.92 mm K-type cable. The DUT attempts to regenerate the same data pattern, while the DUT output is routed to both the BERT error detector input and the oscilloscope channel 1 via 2.92 mm K-type tables and a power splitter. An error-free reference signal is connected between the BERT D2 output to the oscilloscope channel 2, along with the error trigger signal from the error detector output to the oscilloscope channel 3. An oscilloscope Edge trigger is set on the rising edge of the error detector output signal on C3.

14 March 2022

WavePulser 40iX vs. Time Domain Reflectomer (TDR) or Vector Network Analyzer (VNA)

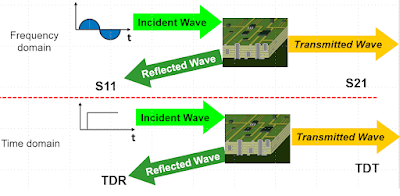
Figure 1: S-parameters and TDR responses are two means to the same end, characterizing interconnects.
Figure 1: S-parameters and TDR responses are two means to
the same end, characterizing interconnects.
Oscilloscopes are used to measure signals, usually as voltages vs. time, and signals come from active devices. But interconnects are passive structures that don’t produce their own signals. To characterize interconnects, you need a stimulus-response system.

There are two, principal types of stimulus-response systems used to characterize interconnects: Vector Network Analyzers (VNAs) used to measure S-parameters in the frequency domain, and Time Domain Reflectometers used to measure impulse responses in the time domain. Each uses a different type of incident signal and a different formalism, but as long as the interconnect is linear, passive and time invariant, both S-parameters and impulse responses yield the same information content in different formats and can be translated from one into another.

So, which do you need? We’ll look briefly at what each does and what are the criteria that might require you to have one versus the other.

07 March 2022

Configuring Dynamic Oscilloscope Measurements Using Advanced Customization

Figure 1. The Advanced Customization option lets you seamlessly and continuously update the input of one parameter with the output of another.
Figure 1. The Advanced Customization option
lets you seamlessly and continuously update the
input of one parameter with the output of another.
With the installation of the Advanced Customization (XDEV) option on Teledyne LeCroy MAUI® oscilloscopes, you can create a measurement parameter whose input value is dynamically updated with each new trigger by the output value of another measurement parameter. All that is required is three simple lines of VBScript. 

To demonstrate, we’ll use the example of taking the x@max value measured on each acquisition and using it to dynamically populate the X position used by the measurement parameter lvl@x. However, these principles could be applied to any two parameters that share a logical/mathematical relationship, or to a parameter and a math function (for example, to use the output of a parameter as the multiplier for a Rescale function).

28 February 2022

Signal and Power Integrity Tutorial: A Robust Method for Measuring Clock Jitter with Oscilloscopes

Figure 1. Clock jitter measured as a variation of clock signal absolute period.
Figure 1. Clock jitter measured as a variation
of clock signal absolute period.
Clock jitter is the variation of a clock signal’s frequency or period. Either measurement carries the same information, but the period measurement is a simple time interval measurement easily performed using a real-time oscilloscope. If we have a robust way of measuring clock jitter, we have the basis for measuring the clock signal’s sensitivity to other features in the environment that can affect the period. Voltage noise on the power rail is just one external force that can affect clock jitter, which we'll show you how to measure in a future post.

In this post, we’ll demonstrate a robust method for measuring clock jitter using an example from Dr. Eric Bogatin’s webinar, “The Impact of Power Rail Noise on Clock Jitter.”  

The clock in our examples is a 5-stage ring oscillator which generates a square wave signal between 10 and 66 MHz. The test instrument is a WavePro HD 12-bit, 4-Ch, 8 GHz, 20 GS/s, 5 Gpts oscilloscope with 60 fs sample clock jitter.

In the process, we make a series of oscilloscope sample clock tests and timebase adjustments as  consistency checks. While measuring jitter is less about absolute accuracy than about the relative precision of measuring the time interval from cycle to cycle, a fundamental part of that is ensuring the absolute accuracy of the oscilloscope’s timebase.