You need to test, we're here to help.

You need to test, we're here to help.

17 January 2022

9 Quick Fixes to Improve DDR Probing

Figure 1: Reversed Handsfree mounts and chip clips help relieve strain on fragile solders.
Figure 1: Reversed Handsfree mounts and chip
clips help relieve strain on fragile solders.
Probing at DRAM pins as required by JEDEC can be challenging. Here are nine, simple ways to improve your DDR probing.

1. Use positioning tools to relieve strain on probe tips

The Handsfree probe holder included as an accessory with several Teledyne LeCroy probes, such as the WaveLink and DH Series probes, was originally designed to put weight on the probe tip to ensure a good contact. However, many DDR probing applications utilize solder-in (SI) tips, where the greater concern is to relieve strain on the tip so as to not disrupt the solder. It turns out that if you use the Handsfree in a “reverse mounted” orientation (Figure 1), it puts the amplifier in a perfect position to help relieve strain on probe tips.

10 January 2022

Oscilloscope Basics: Stabilizing Waveform Display, Pt. 2

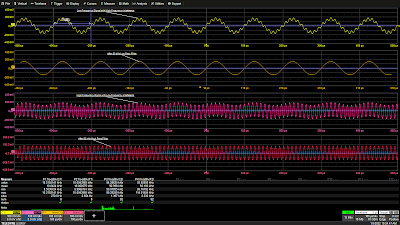
Figure 1: A 50 kHz low-pass filter eliminates a 93 kHz interfering signal from a 10 kHz signal (top two grids) and a 50 kHz high-pass filter cleans up a 93 kHz signal with an additive 10 kHz interfering signal (bottom two grids). Click image to expand.
Figure 1: A 50 kHz low-pass filter eliminates a
93 kHz interfering signal from a 10 kHz signal (top two grids)
and a 50 kHz high-pass filter cleans up a 93 kHz signal
with an additive 10 kHz interfering signal (bottom two grids).
Click image to expand.
In Pt. 1, we discussed the fundamental cause of unstable waveform displays. In this post, we’ll discuss how to use signal conditioners and conditional triggering to help the oscilloscope ignore extraneous samples when determining where the acquisition trigger event actually occurs.

Coupling 

In the Setup section of the Trigger dialog, Trigger input sources can be conditioned using AC or DC coupling, high-pass filters (LFREJ for low-frequency reject) and low-pass filters (HFREJ for high-frequency reject). The frequency selective coupling paths are used to attenuate extraneous signals. The low-frequency reject inserts a 50 kHz high-pass filter in the trigger signal path, which is useful for eliminating low-frequency interference such as 60 Hz power mains signals. This low-frequency noise can cause erroneous triggers, resulting in an unstable display. The high-frequency reject inserts a 50 kHz low-pass filter. This coupling mode finds use in applications such as troubleshooting switch-mode power supplies, where it suppresses signals at the power supply switching frequency. Like any extraneous signal, high frequency pickup can leak into the input signal and cause trigger instability. Figure 1 provides examples of how the HFREJ and LFREJ coupling filters eliminate interfering signals from the trigger source.

04 January 2022

Oscilloscope Basics: Stabilizing Waveform Display, Pt. 1

Figure 1: A free running oscilloscope starts each acquisition at a different point on the waveform, resulting in an unstable display.  A triggered oscilloscope starts each acquisition at the same point on the waveform, resulting in a stable display.
Figure 1: A free running oscilloscope starts each
acquisition at a different point on the waveform,
resulting in an unstable display.  A triggered oscilloscope
starts each acquisition at the same point on the
waveform, resulting in a stable display. 
An unsynchronized, unstable oscilloscope display is useless for making measurements, but proper triggering can synchronize the oscilloscope sample clock to specific waveform events so that the acquired waveforms appear stable on the display.  Let’s look at why signals can appear unstable and what to do about it.  

Oscilloscopes are sampling devices; they sample the incoming signal at a uniform rate.  The timing of a signal applied to the input of an oscilloscope is most probably asynchronous with the oscilloscope’s sampling clock.  If the oscilloscope timebase is allowed to run free—that is, not synchronized to the timing of the input signal—then each oscilloscope acquisition potentially begins at a different point on the input waveform, as shown in Figure 1.

13 December 2021

USB4 Alt-Mode Testing: DPAUX and USB-PD

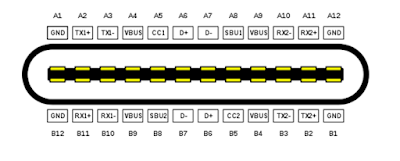
Figure 1: The interfaces that make up the USB-C connector and their relationships.

The USB Type-C® (USB-C) connector supports not only USB data transfers at speeds of up to 20 Gb/s but also can be reconfigured to support a wide variety of other interfaces through the USB4 provision for alternative (Alt) modes. The Alt-Mode protocols supported include Thunderbolt™, Mobile High-Definition Link (MHL), Peripheral Component Interconnect Express (PCIe®), High-Definition Multimedia interface (HDMI®) and DisplayPort™ (DP).

The diagram of the USB-C receptacle in Figure 1 shows where it potentially switches from normal operation into Alt-Mode.

06 December 2021

Testing DisplayPort 2.0 vs. USB4 Over USB Type-C Connectors

Figure 1: The pin out of the USB Type-C connector.

DisplayPort™ 2.0 (DP 2.0) is a high-resolution video interface and USB4® is a high-speed data interface; what they have in common is the USB Type-C® (USB-C) connector. While DP 2.0 can also be deployed on the standard DisplayPort as well as mini-DisplayPort connectors, it is the USB-C connector that really excites electronics manufacturers because now they can use a single connector for high-speed data, high-resolution video and even power distribution. 

Figure 1 shows the pin assignments for a USB-C connector, which is a mechanically reversible connector that includes four, high-speed differential data lines: TX1, TX2, RX1 and RX2.

In USB4 operations, the four data lines TX1, TX2, RX1 and RX2 form a dual-lane, duplex signal path, supporting 10 and 20 Gb/s transfers on each line. When operating in USB4 Alt mode, up-to-four of these buses can be reassigned to become four DP 2.0 video lanes, which operate at 10, 13.5 or 20 Gb/s.

Testing for both interfaces over the USB-C connector is similar, but there are some notable differences.

29 November 2021

DisplayPort 2.0 Physical Layer Testing

Figure 1. Functional diagram of DisplayPort 2.0 over USB-C Source (Tx) PHY testing.
Figure 1. Functional diagram of DisplayPort 2.0
over USB-C Source (Tx) PHY testing.

The Video Electronics Standards Association (VESA) DisplayPort 2.0 video interface introduces a new performance standard with an increase in data bandwidth of three times compared to the older DisplayPort 1.4a specification, achieved by using four lanes of  up-to-20 Gb/s data per lane. This permits display resolutions to better than 8K, higher refresh rates and better dynamic range. These advantages are available using native DisplayPort connectors as well as the USB Type-C connector, which allows devices to handle video data, USB data and power all in the same connector.


With the USB-C cable now carrying DisplayPort and lower-speed sideband data, testing for USB devices has expanded to cover many dependencies between these protocols. This series will give an overview DisplayPort 2.0 physical-layer testing and how it relates to USB testing.

22 November 2021

What Is Differential Manchester Encoding?

Figure 1. Differential Manchester encoding is based on the presence or absence of a transition, whereas Manchester  encoding relies on the polarity of the transition.
Figure 1. Differential Manchester encoding is based on the
presence or absence of a transition, whereas Manchester 
encoding relies on the polarity of the transition.
Differential Manchester Encoding (DME) is an example of a differential, bi-phase encoding technology. DME is specified in the IEEE 802.5 standard for Token Ring local area network (LAN) topology. 

Manchester is categorized as bi-phase encoding because the signal is checked twice every bit interval, also called self-clocking. Each check is one “tick”, each bit interval equals two ticks of the clock. This removes the need for the separate clock signal that is required for Non-Return to Zero (NRZ) encoding. Instead, data and clock signals are combined into a single, two-level, self-synchronizing data stream. The clock can be "extracted" by measuring the timing of the edges.

Figure 2. In Manchester encoding, the polarity of the transition that occurs mid-interval determines the logic.
Figure 2. In Manchester encoding, the polarity of the
transition that occurs mid-interval determines the logic.
In Manchester encoding, we see a digital modulation scheme where voltage transitions rather than voltage levels are used to represent 1s and 0s. In IEEE 802.3 Manchester, a high-to-low transition occurring in the middle of the bit interval represents logical 0, while a low-to-high transition represents logical 1 (the G.E. Thomas variant reverses this logic). Significant transitions always occur in the middle of the bit interval to ensure clock synchronization. Transitions at the start of a period are only used to reset the polarity to achieve the proper transition for the next bit. This increases error detection capabilities, compared to NRZ, but also increases the bandwidth needed to transmit the signal at the same data rate, making it a better candidate for short-distance applications.

Figure 3. Even inverted, DME signals result in same logic.
The most prominent feature that distinguishes DME from classic Manchester encoding is that, in DME only the presence or absence of a transition during the bit interval is important, not the polarity. The presence of a transition represents a logical 0, while the absence of a transition represents a logical 1. Whether the signal goes line-high or line-low depends simply on its state the previous bit interval. This increases bit rate at lower bandwidths, because one bit is guaranteed to occur every interval. It also helps with data recovery in noisy environments, like automotive, because DME allows for a data stream to be inverted, yet still be properly decoded, unlike classic Manchester where the polarity is significant. 

DME is used for 10Base-T1S Automotive Ethernet, a short-distance, low-bandwidth application with either a point-to-point or bus topology up to 25 m. 

Teledyne LeCroy offers QualiPHY compliance test solutions for 10Base-T1S, including a QPHY-10Base-T1-TDR option that automates all required MDI S-parameter tests using the WavePulser 40iX.