 |
| Figure 1: In USB 3.0 link-layer compliance test, all logical states of the LTSSM come into play |
You need to test, we're here to help.
You need to test, we're here to help.
30 January 2015
Plan For Successful USB Compliance Testing (Part III)
26 January 2015
Plan For Successful USB Compliance Testing (Part II)
 |
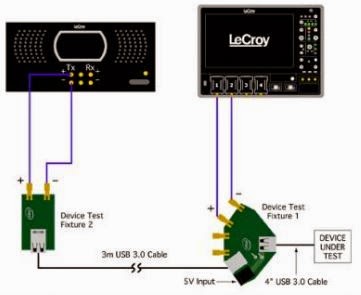
| Figure 1: A representative transmitter compliance test setup |
16 January 2015
Plan For Successful USB Compliance Testing (Part I)
 |
| Figure 1: The coveted SuperSpeed USB logo |
30 December 2014
Filtering Signals with MATLAB
 |
| Figure 1: A 2-pole, 1-MHz Butterworth low-pass filter applied to an acquired waveform |
17 December 2014
What S-parameters Reveal About Interconnects (Part III)
 |
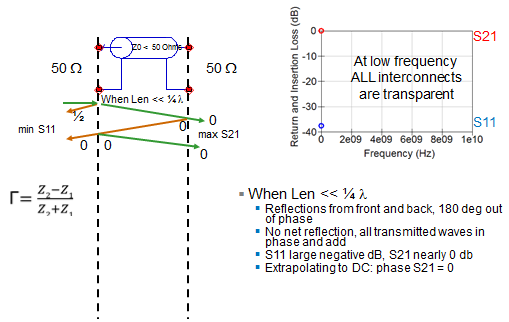
| Figure 1: How ripple is introduced into S11 and S21 |
09 December 2014
What S-parameters Reveal About Interconnects (Part II)
 |
| Figure 1: Measuring S-parameters of a two-port interconnect |
03 December 2014
What S-Parameters Reveal About Interconnects
 |
| Figure 1: S-parameters are derived by applying an incident wave to an interconnect; we can consider this process in either the time or frequency domains |
Subscribe to:
Posts (Atom)