
 |
| Figure 1: A representative block diagram of a mixed-signal embedded system |
16 April 2014
Is Your Testbench Mixed-Signal Ready?

09 April 2014
Applying Multi-Stage, Multi-Rate Digital Filtering
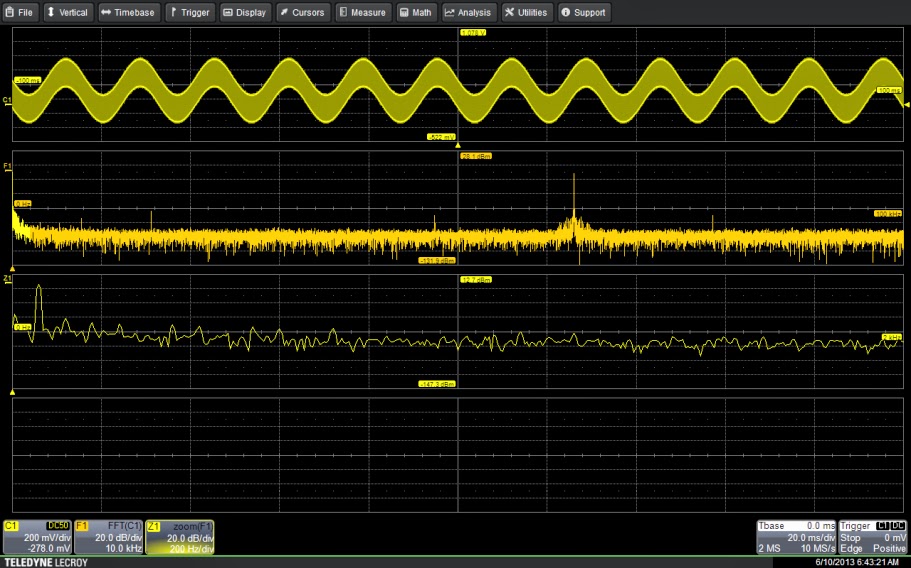 |
| Figure 1: The input signal shows both the desired 63-kHz signal along with a 60-Hz component. Zoom trace Z1 shows the 60-Hz component in detail. |
02 April 2014
Understanding Probe Calibration Methods (Part II)
 |
| Figure 1: Experimental setup for comparing a source-referred signal to an unloaded signal |
26 March 2014
Using Digital Filters
 |
| Figure 1: Using a band stop filter to remove a 5-MHz sine wave from a 4-MHz square wave |
19 March 2014
Tips and Tricks: Rescaling for Non-Voltage Measurements
 |
| Figure 1: Using math rescale to read a current probe's output directly in Amperes |
12 March 2014
Use Trend Functions To Take Power's Pulse
When troubleshooting or debugging almost anything, the first step is usually to check what's going into the device or circuit and what's coming out on the other side. So it is with power supplies, which leads us to power line monitoring and trend functions.
05 March 2014
Measuring Time-Interval Error in Serial Data Waveforms
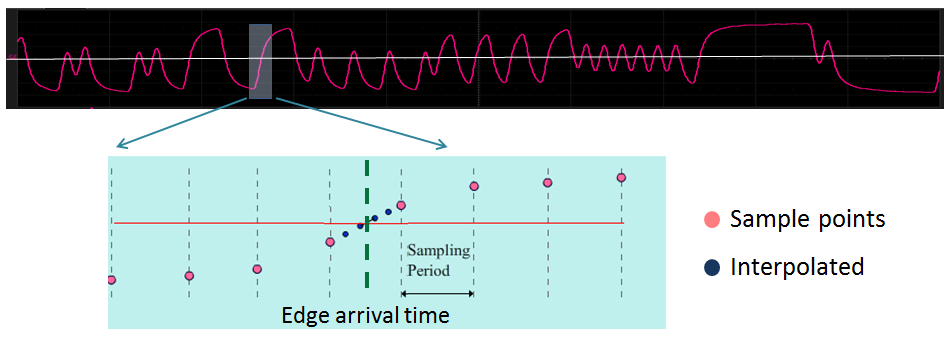 |
| Figure 1: The first step in quantifying jitter is to determine measured times of arrival for bit transitions |
Subscribe to:
Posts (Atom)