You need to test, we're here to help.

You need to test, we're here to help.
Showing posts with label statistical parameters. Show all posts

12 April 2021

How to Use Measurement Statistics to Set Up Triggers

Figure 1.  Histogram of the different pulse widths occurring in a pulse-width modulated rectangular pulse train.
Figure 1.  Histogram of the different pulse widths occurring
in a pulse-width modulated rectangular pulse train.
Triggering is an essential element in all modern digital oscilloscopes.  The trigger synchronizes the oscilloscope’s data acquisition with a user-specified event on the signal, be that an edge, threshold crossing or a specific signal characteristic. Teledyne LeCroy Smart Triggers can trigger oscilloscope acquisitions based on properties such as a period, width, low signal amplitude, slew rate or signal loss. These trigger types are ideal for capturing transient events like glitches, but they require knowing at least a range of possible values for the trigger to detect.

Intermittent transient events and glitches are among the most frustrating problems to detect and solve. This is especially true if you have no idea about the nature of the transient. However, you can use the oscilloscope’s measurement tools to help locate these bothersome transients, then use that information to set up your trigger to capture them when they occur. Here’s how.

30 January 2018

Getting The Most Out Of Your Oscilloscope: Cursors and Parameters

Cursors (top) and parameter measurements (bottom) are both powerful tools in their own right
Figure 1: Cursors (top) and parameter
measurements (bottom) are both
powerful tools in their own right
Oscilloscopes give us a wealth of tools with which to view, measure, and analyze the performance of a circuit. Broadly speaking, two classes of such tools are cursors and parameter measurements. Taken on their own, both classes afford the user a great deal of capability. Put them together, though, and you can really start to gain deep insights into what's going on with a waveform.

20 March 2015

Using Histograms (Part III)

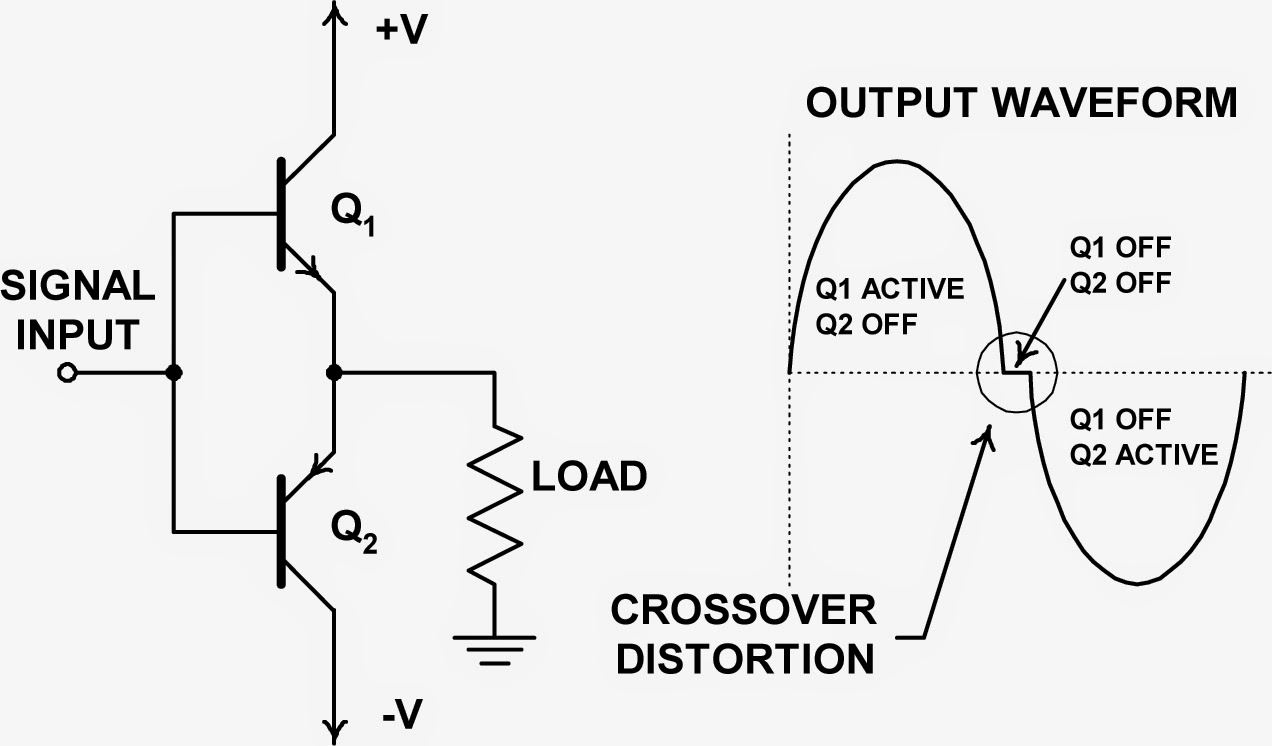
A simplified view of a push-pull amplifier showing the source of crossover distortion
Figure 1: A simplified view of a push-pull amplifier
showing the source of crossover distortion
In this third post in a series on using an oscilloscope's histogram capabilities, let's take a look at using histograms as a diagnostic tool. Diagnosing problems in a circuit calls for good skills and some intuition on top of good measurement tool. In general, though, the more ways in which you're able to look at a problem, the more likely it is that you'll turn up the root cause.

27 February 2015

Using Histograms (Part II)

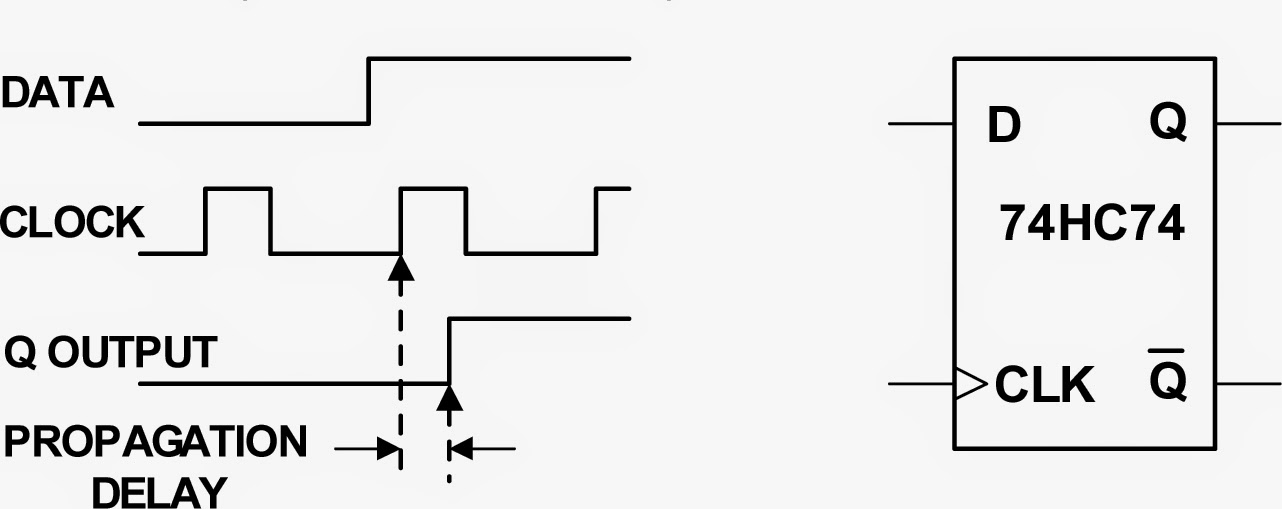
Figure 1: A flip-flop's propagation delay is a typical spec that can be derived using statistical analysis
Figure 1: A flip-flop's propagation delay is a typical spec
that can be derived using statistical analysis
In Part I of this series, we looked at some of the basics of histograms and how they can provide a statistical view into random variation of signal parameters. Next, let's look at how histograms can help us use statistical analysis to determine product specifications.