 |
| Figure 1: Test-equipment requirements for PCIe 3.0 |
PCIe 3.0 compliance testing calls for three different sections of electrical testing (Figure 1):
- Physical-layer electrical transmitter testing: You'll need to look at jitter analysis and eye diagrams of transmitted data streams. For these tests, an oscilloscope is required.
- Physical-layer electrical receiver testing: These tests require a bit error-rate tester (BERT) and an oscilloscope. The BERT puts the DUT into loopback and sends a calibrated signal with jitter and noise for the bit error-rate (BER) testing. The oscilloscope is required for calibration.
- Link-equalization testing: This section requires an oscilloscope, a protocol-enabled receiver tester, and test software.
 |
| Figure 2: Shown is a representative example of a PCIe 3.0 test setup for design/debug or compliance testing |
Figure 2 is a schematic representation of what a PCIe 3.0 test setup might look like. On the left is a protocol-enabled receiver tester; one example of this kind of instrument is Teledyne LeCroy's PeRT 3 Phoenix test system. On the right is an oscilloscope suitably equipped for these tasks; an example would be Teledyne LeCroy's SDA 830Zi-B oscilloscope. At center bottom of the figure is an add-in card DUT plugged into test fixtures.
The PeRT 3 can stand in for either a system board or an add-in card, depending on what's being tested. In this example, we're testing an add-in card so the PeRT 3 will behave as though it were a system board. It also affords us a means of controlling the add-in card and exercising the behavior we want to test.
 |
| Figure 3: The PeRT 3 walks the DUT through the LTSSM for your viewing pleasure |
We feed a trigger from the PeRT 3 to the oscilloscope's auxiliary input so that we can trigger at a specific point. So we don't have to capture the entire equalization sequence to view the transactions we're interested in at any given time. Because in this case we're testing an add-in card, we want to supply a clock from the PeRT 3 to the add-in card. We will use the PeRT 3 to exercise the add-in card, pick off the signal of interest, and observe it on the oscilloscope.
As the PeRT 3 walks the DUT through the various states of the link-equalization process, it logs each of the states so that you can view them and see what's happening. In the link-training status state machine (LTSSM), you can follow the states from detect, polling, configuration, L0, recovery, and so on (Figure 3). Then, even within the receiver equalization process, you can follow the four phases, and correlate that with the protocol-level view.
You can also set a trigger-out from the PeRT at any one of, or a number of, these states. So if you want to see exactly what the DUT is doing at, for example, Phase 2 of recovery.equalization, you can set a trigger for that state.
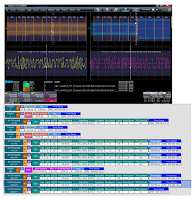
Another element of the test setup is Teledyne LeCroy's ProtoSync software. ProtoSync runs on the oscilloscope and affords simultaneous views of the physical waveform, protocol decode annotation overlays, and the protocol-analysis view. Thus, we can view the waveform and the protocol view side by side. We can see what's happening in the protocol correlated with what happens at the physical level.
Clicking on a packet in the protocol view hyperlinks it back to the electrical view, zooming to that location in the waveform. We can identify, for instance, a preset request in Phase 3, click on that in the protocol view, and then see exactly where that request was sent in the electrical waveform.
The next post in the series on the PCIe 3.0 testing process will provide some measurement examples.
As the PeRT 3 walks the DUT through the various states of the link-equalization process, it logs each of the states so that you can view them and see what's happening. In the link-training status state machine (LTSSM), you can follow the states from detect, polling, configuration, L0, recovery, and so on (Figure 3). Then, even within the receiver equalization process, you can follow the four phases, and correlate that with the protocol-level view.
 |
| Figure 4: ProtoSync provides simultaneous protocol- and physical-layer views |
Another element of the test setup is Teledyne LeCroy's ProtoSync software. ProtoSync runs on the oscilloscope and affords simultaneous views of the physical waveform, protocol decode annotation overlays, and the protocol-analysis view. Thus, we can view the waveform and the protocol view side by side. We can see what's happening in the protocol correlated with what happens at the physical level.
Clicking on a packet in the protocol view hyperlinks it back to the electrical view, zooming to that location in the waveform. We can identify, for instance, a preset request in Phase 3, click on that in the protocol view, and then see exactly where that request was sent in the electrical waveform.
The next post in the series on the PCIe 3.0 testing process will provide some measurement examples.
Previous posts in this series:
The Hows and Whys of PCIe 3.0 Dynamic Link Equalization
PCIe 3.0 Dynamic Link EQ: De-Emphasis, Preshoot, Cursors, and Presets
An Under-The-Hood View of PCIe 3.0 Link Training (Part I)
An Under-The Hood View of PCIe 3.0 Link Training (Part II)
No comments:
Post a Comment