You need to test, we're here to help.

You need to test, we're here to help.

10 October 2022

Oscilloscope Testing of 10Base-T1S Automotive Ethernet Signal Integrity

Eye diagram generated from decoded 10Base-T1S signal
Figure 1. The 10Base-T1S TDME option features
easy eye diagram creation for signal integrity analysis.
Click on any image to enlarge it.
In addition to special serial data bus measurements of 10Base-T1S signals, the 10Base-T1S Trigger, Decode, Measure/Graph & Eye Diagram (TDME) option automates the generation and display of eye diagrams on Teledyne LeCroy oscilloscopes. Eye diagrams are an important element of serial data analysis, used to understand the signal integrity of the communications network. 

The eye diagram is a general-purpose tool for analyzing serial digital communications signals. It shows the effects of additive vertical noise, horizontal jitter, duty cycle distortion, inter-symbol interference, and crosstalk on a serial data stream. 

The eye diagram is formed by overlaying repetitive occurrences of slightly more than a single clock period (UI) of a serial data signal on a persistence display which shows the accumulated history of multiple acquisitions, as shown in Figure 1.

Due to the use of Differential Manchester encoding (DME), the 10Base-T1S eye is formed with twice the signal clock rate. The signal shown has a symbol rate of 12.5 Mbps and the eye is clocked at 25 Mbps. 

05 October 2022

Oscilloscope Measurements of 10Base-T1S Automotive Ethernet PLCA Cycle Timing

10Base-T1S frame with color-coded decoder overlay
Figure 1. Color-coded decoding of 10Base-T1S
stream makes it easy to measure timing between
signal elements. Click on any image to enlarge.
The 10Base-T1S Trigger-Decode (TD) and 10Base-T1S Trigger, Decode, Measure/Graph & Eye Diagram (TDME) options enable Teledyne LeCroy oscilloscope users to trigger on and decode Ethernet control and payload data from 10Base-T1S Automotive Ethernet signals. The decoding is color-coded to provide fast, intuitive understanding of the relationship between message frames and other time-synchronous events. Knowing the location of the various protocol elements makes it easy to measure Physical Layer Collision Avoidance (PLCA) cycle timing using either standard oscilloscope tools, or special serial bus measurements included with the TDME options.

PLCA cycle timing is measured to assure interoperability of the attached nodes in a 10Base-T1S mixed-segment, multidrop bus. This class of tests measures the timing between events on the bus relative to a specific bus event, usually the BEACON signal initiated by the Master node. 

Let’s look at a simple example of a 10Base-T1S network with two nodes, the Master (Node 0) and a device (Node 3). The acquired waveform is shown in Figure 2, decoded using the 10Base-T1S TDME option. The top grid shows the complete acquisition, which consists mostly of BEACON signals over a record of twenty-five million samples. Toward the end of the acquisition are two packets from the other nodes. The table at the bottom of the screen lists all the elements decoded in the full acquisition.

12 September 2022

Isolated Oscilloscope Inputs vs. Isolated Oscilloscope Probes

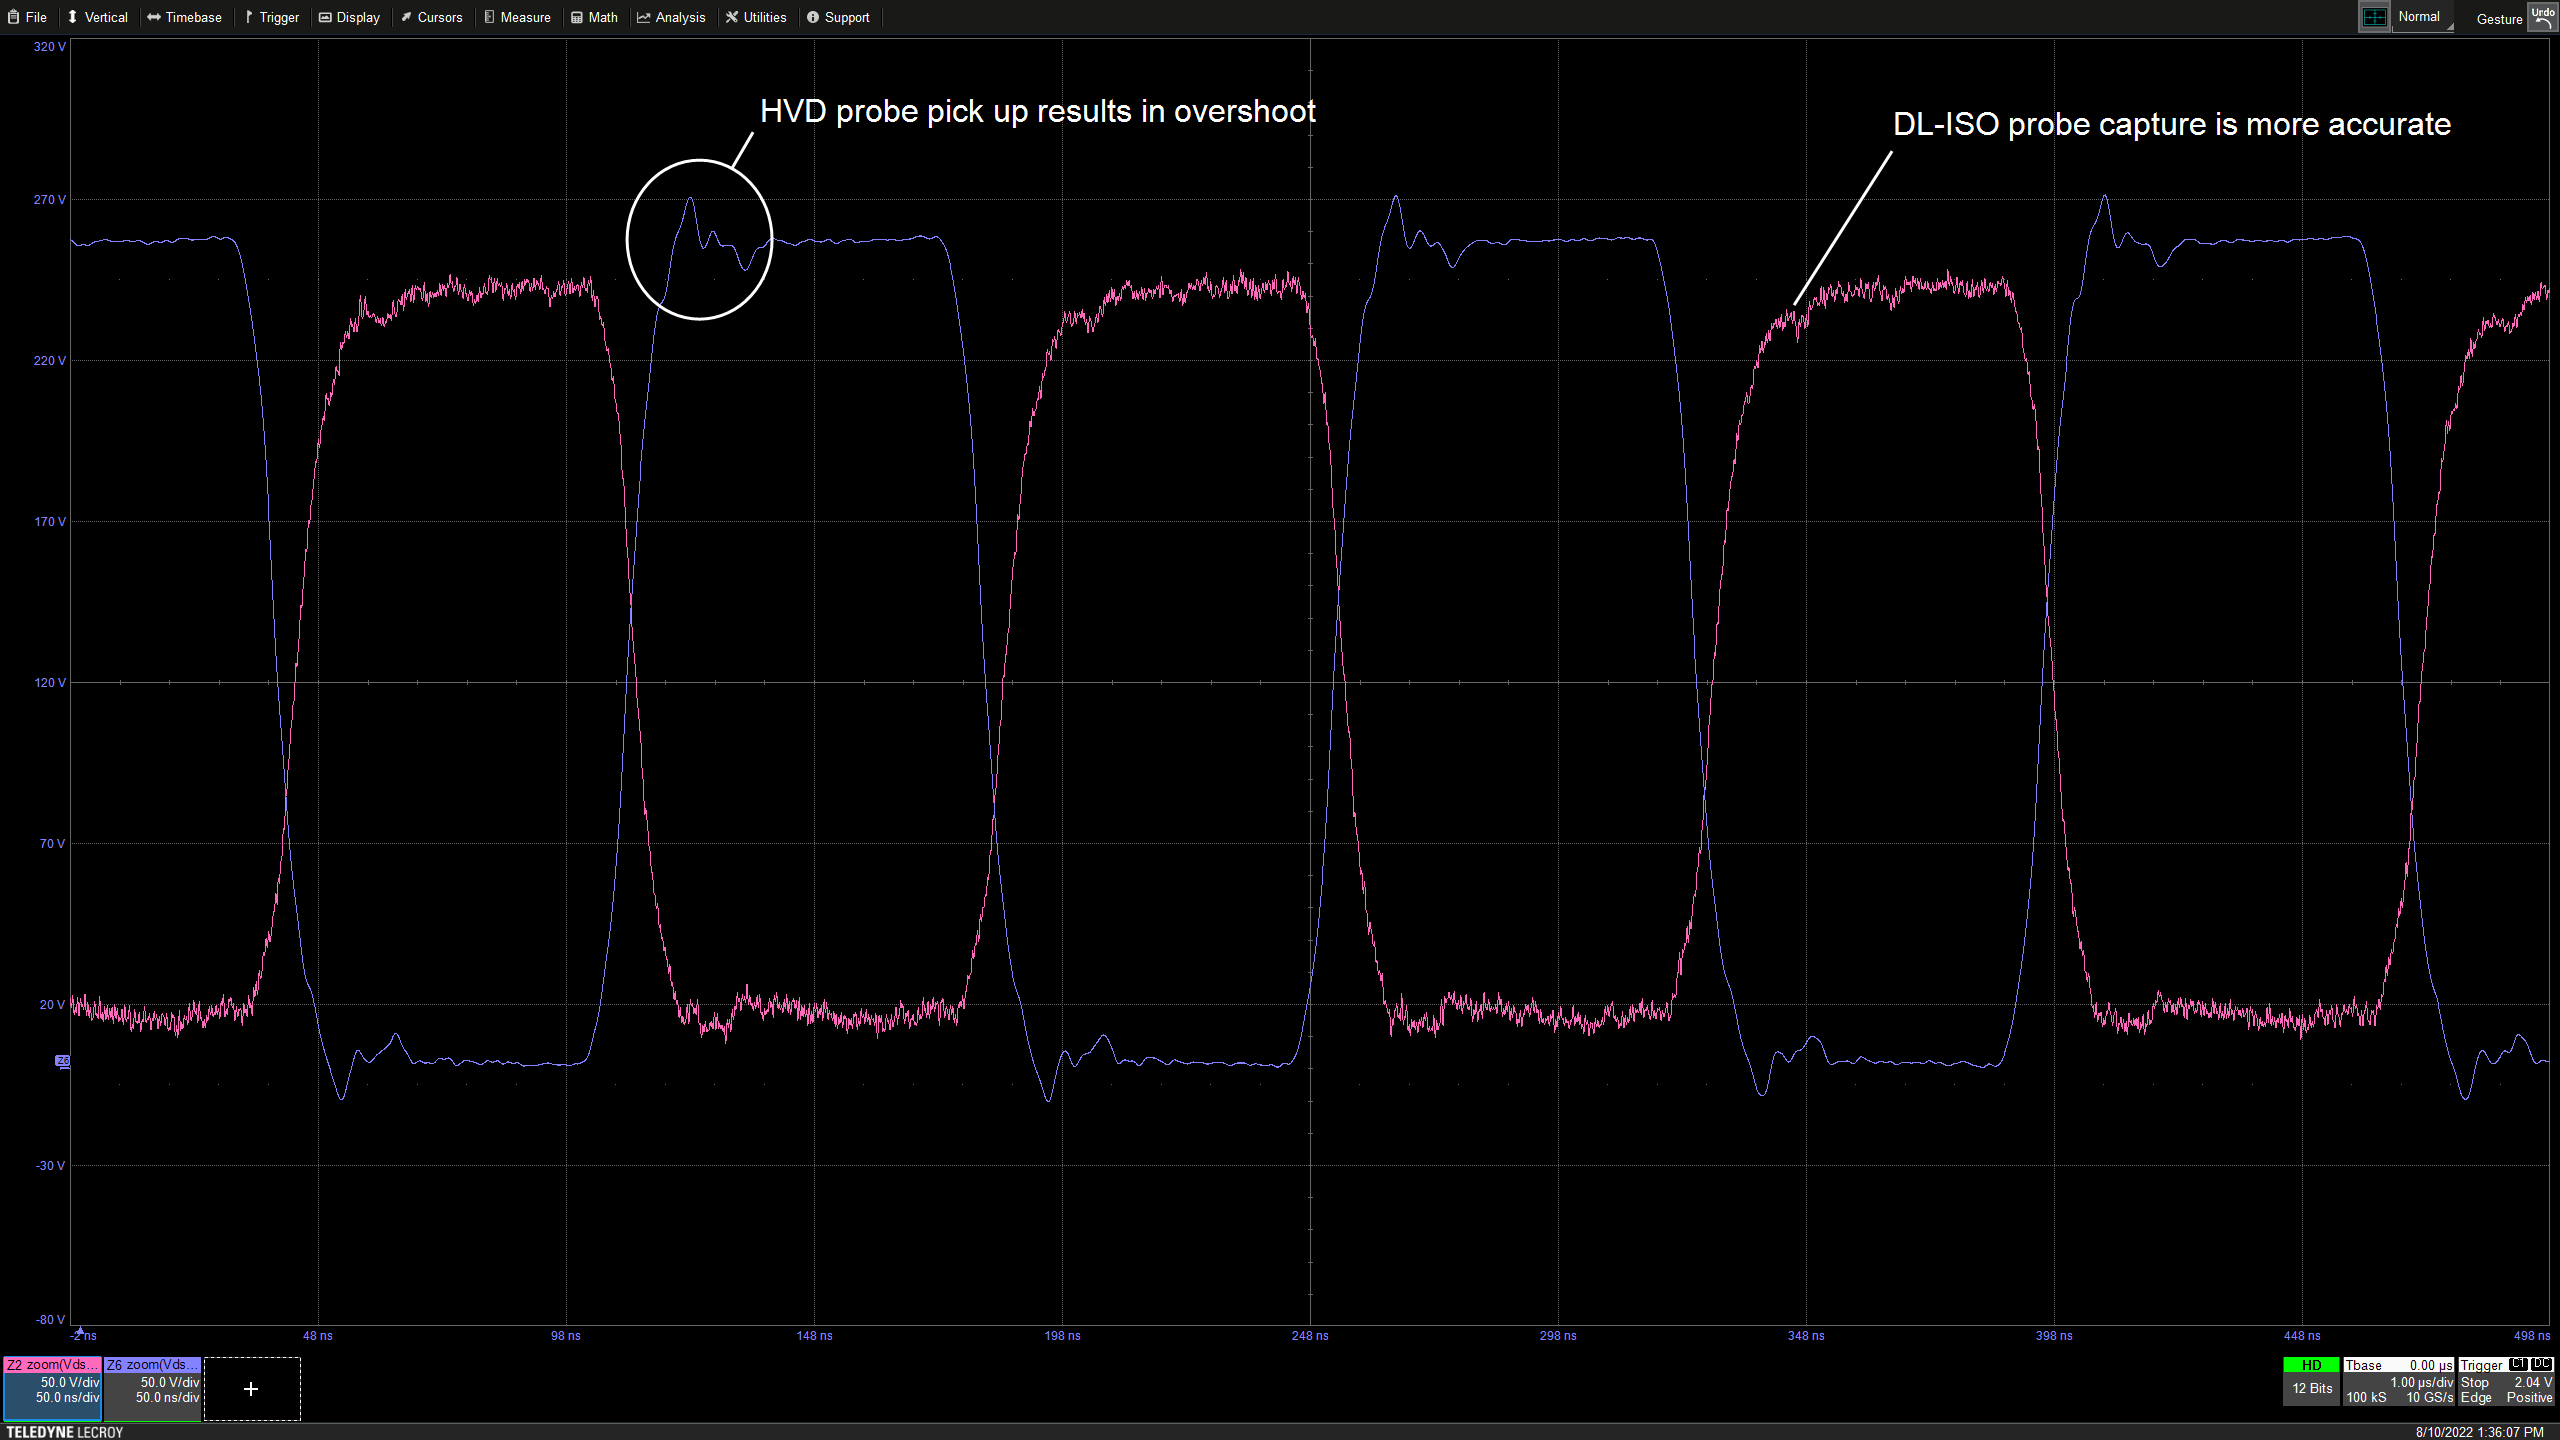
Some users in high-voltage test environments seek measuring instruments with isolated inputs because they want the safety and convenience of isolation without having to spend money on an isolated oscilloscope probe, like the Teledyne LeCroy DL-ISO or the Tektronix IsoVu®. While that's understandable, isolated inputs built into the instrument channel may be convenient, but they don't necessarily give you good performance, certainly not as good as  you would get from a high quality, high-voltage isolated probe.

Figure 1. Cascaded H-bridge signals captured using an isolated input (left) and an isolated probe (right).

05 September 2022

Choosing a High-voltage Oscilloscope Probe for SiC/GaN Power Semiconductor Device Measurements

Wide-bandgap (GaN) power semiconductor device waveforms captured using two, different probe topologies
Figure 1: Wide-bandgap (GaN) power semiconductor device
waveforms captured using two, different probe topologies.
Click on any image to expand.
In our last post, we introduced you to a new tool on the Teledyne LeCroy website: The High-voltage Probe Selection Guide. To demonstrate the benefits of the guide, let’s explore further what must be considered when choosing an HV oscilloscope probe for power semiconductor device measurements.

Why are power semiconductor device measurements challenging?

29 August 2022

How to Choose the Best High-voltage Oscilloscope Probe in 5 Minutes

High-voltage Probe Selection Guide color codes better or worse probe selections.
Figure 1: The High-voltage Probe Selection Guide
color codes better or worse probe selections based on
your answers to three, simple questions.
Click any image to enlarge.
Probing high-voltage (HV) circuits for analysis with an oscilloscope presents unique challenges due to the potential for injury or equipment damage, as well as the demands of the materials used in HV semiconductors. HV floating measurements are extremely dangerous and difficult to make. Conventional passive probes are not the answer, but isolated and high-voltage differential probes are options. Yet, with many possible choices in these categories, how can you decide which is actually the best HV oscilloscope probe for your application?

Teledyne LeCroy offers this new, easy way to help you select a high-voltage oscilloscope probe based on your specific application—the High-voltage Probe Selection Guide—available on the Teledyne LeCroy website at: teledynelecroy.com/powerprobes

22 August 2022

Physical-Layer Collision Avoidance in 10Base-T1S Automotive Ethernet

Fig.1, 10Base-T1S PLCA cycle. If there is no data traffic (top), only BEACONs are seen on the bus.  Data from a node (bottom) will expand the time between two BEACONs.
Fig.1, 10Base-T1S PLCA cycle. If there is no data
traffic (top), only BEACONs are seen on the bus. 
Data from a node (bottom) will expand the time
between two BEACONs.
10Base-T1S (IEEE 802.cg) is a variant of Automotive Ethernet  that supports half-duplex and full-duplex communication, allowing either a point-to-point direct connection between two nodes, or use of a multidrop topology with up-to-eight nodes connected on a single 25 m bus segment.

Multidrop cabling of one bus line provides options to extend and scale with fewer physical wires and less weight than point-to-point topologies. With minimum connector space at the ECU, the bus line can be expanded simply by adding sensor units. A bus line with additional sensor units for ultrasonic and short-range radar is an example of how multidrop cabling can be scaled.  

Among the main objectives of the 10Base-T1S PHY layer are reconciliation of transmissions from a variety of mediums, ensuring cooperative behavior by the nodes on a multidrop bus. One way it does this is through the use of Physical-Layer Collision Avoidance (PLCA) technology to minimize dead time and avoid collisions. In this post, we'll describe the workings of PLCA and in a future post, how you can debug PLCA timing issues using an oscilloscope with the 10Base-T1S TDME software.

15 August 2022

10Base-T1S Automotive Ethernet vs. 10Base-T1L Industrial Ethernet

Figure 1: 10Base-T1S and 10Base-T1L differ primarily in reach, encoding methods, topology and applications.
Figure 1: 10Base-T1S and 10Base-T1L differ primarily in
reach, encoding methods, topology and applications.
10Base-T1S, a variant of Automotive Ethernet, and 10Base-T1L, also known as Industrial Ethernet, are Single Pair Ethernet (SPE) protocols described in IEEE 802.cg standards. Both offer the same 10 Mb/s communication speed using a single, unshielded twisted pair (T1), but differ in specifics of reach, encoding schemes and topologies, as well as their principal applications.