 |
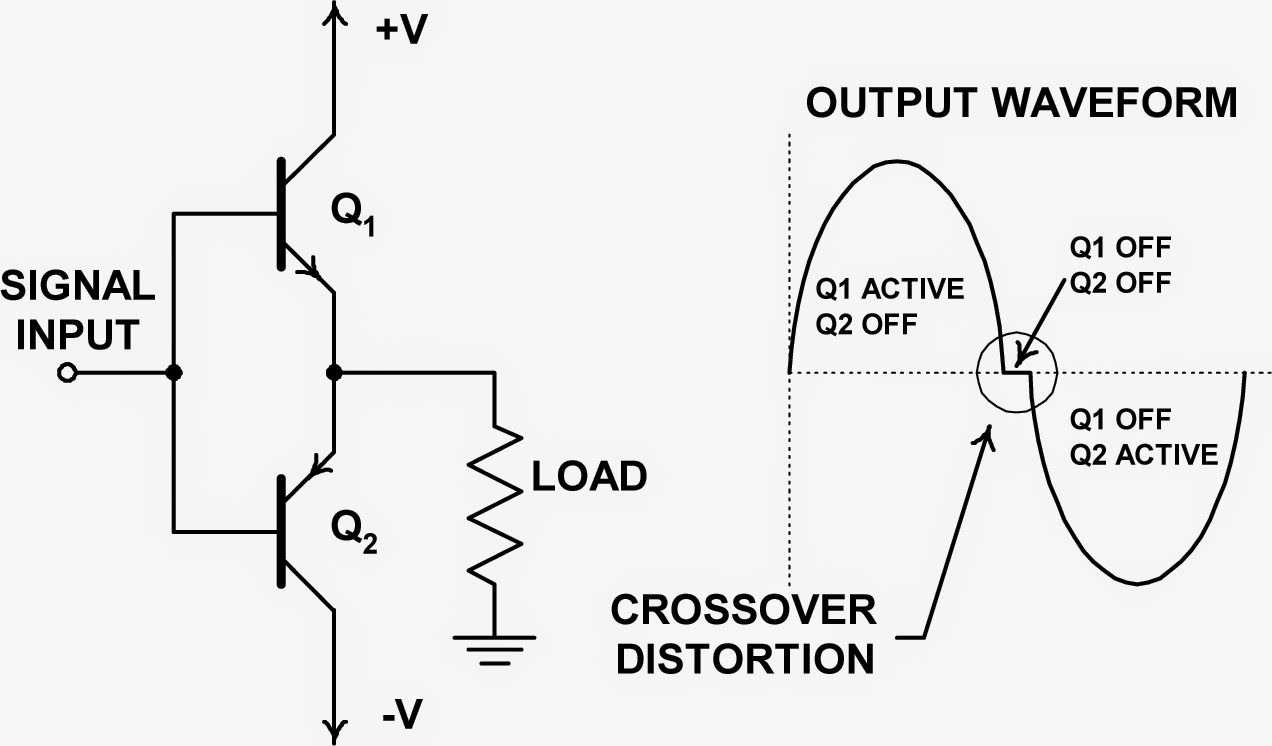
| Figure 1: A simplified view of a push-pull amplifier showing the source of crossover distortion |
Many oscilloscopes, including Teledyne LeCroy's, offer frequency and statistical domain processing that can be of great utility to troubleshooters. These capabilities provide alternate views of the acquired data that in turn present addition perspective for diagnosis.
 |
| Figure 2: A time-domain waveform with crossover distortion |
 |
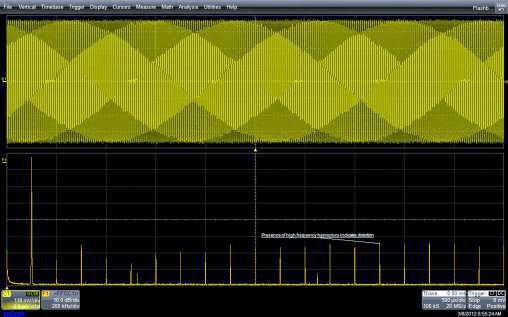
| Figure 3: The FFT shows high harmonic content due to distortion but does not help determine its root cause |
 |
| Figure 4: The histogram of data amplitude (lower left) reveals a higher-than-normal number of sample values at the zero crossing. |
Histograms are created by dividing the amplitude range of the oscilloscope into 20 to 5000 bins (100 bins are used in this example). The number of samples falling into each bin is plotted, on the vertical axis, against the nominal voltage value of the bin on the horizontal axis. The histogram of the data values shows the number of samples in the waveform within each small voltage range.
In Figure 4, the histogram in blue at lower left is of our signal with crossover distortion while the plot in yellow at lower right is of a properly functioning amplifier. Now we are able to compare them. As seen in the yellow histogram of a sine wave, the histogram assumes a shape not unlike that of a saddle. But the blue histogram shows us an abnormal number of sample values at the center, which represents the zero-volt crossover. The waveform is hesitating at the zero crossing, which is a sure sign of crossover distortion. If our signal was clipping or limiting, we would see this manifested in the histogram as a higher-than-normal population at the maximum and/or minimum peaks. Distortion caused by asymmetry would appear as an asymmetric histogram plot.
Thus, we see that the ability to view a signal in the time, frequency, and statistical domains is a very powerful tool in the diagnosis of complex circuit aberrations.
No comments:
Post a Comment