 |
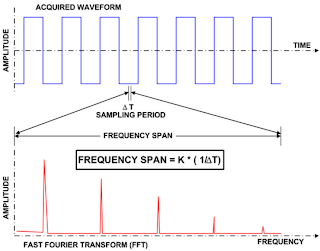
| Figure 1: Capture time determines the frequency resolution, Δf. |
Why would one want to apply FFTs to a waveform? Again, for many signals, there's a lot of information to be had by looking at a spectral representation as opposed to a time-domain view. Take, for example, the frequency response of an amplifier, or oscillator phase noise, and signals encountered in mechanical vibration analysis, among many others; all of these are best observed in the frequency domain.
 |
| Figure 2: The span of the FFT is related to the sampling rate, 1/ΔT. |
How does one go about setting up an FFT for an acquired waveform? First, consider that the FFT span is related to the sampling rate, and that the resolution bandwidth, Δf, is inversely proportional to the record length. These basic relationships are shown in Figures 1 and 2.
Logically, the place to start in setting up an FFT is with the frequency resolution, Δf. It determines the spacing of samples in the frequency-domain display and is similar to the resolution bandwidth setting in an RF spectrum analyzer.
The Δf is set by the time duration of the time-domain signal that is the input to the FFT. If an acquisition channel is the source, the waveform duration is the capture time, which is ten times the time/division setting of the oscilloscope. The relationship between capture time and Δf is shown in Figure 2.
The frequency span of the FFT is called the Nyquist frequency and is one half of the effective sampling frequency of the time-domain waveform. Teledyne LeCroy oscilloscopes will generally default to the highest sampling rate and therefore the longest span.
 |
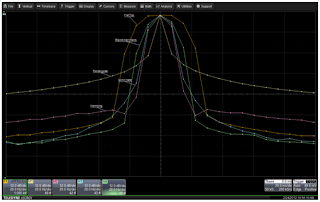
| Figure 3: The spectral "shapes" of each of the window weighting functions. |
Some oscilloscopes offer the ability to choose the operative FFT algorithm. In the case of Teledyne LeCroy instruments, users may choose between a power-of-two algorithm and a least-primes algorithm. The former runs faster than the latter, but delivers a record length that is not the same as that of the acquired signal. The least-primes algorithm computes FFTs on transform sizes that have lengths expressible as factors of 2N* 5K. This is highly compatible with the record lengths one encounters in an oscilloscope, which are often multiples of 1, 2, 4, 5, or 10.
Hopefully, the foregoing will help you get started on frequency-domain analysis of your time-domain signals. Let us know if you have questions or issues we can help with!

No comments:
Post a Comment