 |
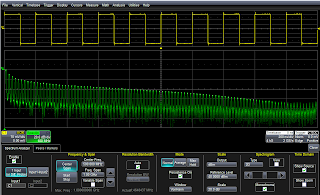
| Figure 1: Spectrum Analyzer software for the HDO series oscilloscopes provides an intuitive user interface |
When you take an oscilloscope such as Teledyne LeCroy's HDO Series and add an optional Spectrum Analyzer software package, it yields an oscilloscope with a spectrum-analyzer-like interface (Figure 1). You're presented with a user interface that is not unlike that of a stand-alone spectrum analyzer. Provided you're familiar with spectrum analyzers, the Spectrum Analyzer interface lets you bypass the intricacies of the FFT itself and set it up on the oscilloscope using familiar parameters such as center frequency, span, and resolution bandwidth. Under the hood, the software takes care of the sampling rate and time-domain acquisition length. There's other settings as well, such as normal or averaged FFTs and choices of reference levels and scales.
In the case of the HDO oscilloscopes, entering Spectrum Analyzer mode is a simple matter of pushing the Spectrum Analyzer button, which brings up the Spectrum Analyzer dialog box (Figure 2). From there, you can select a source trace from any input channel, math operation, memory trace, or zoom trace.
 |
| Figure 2: A closer look at the Spectrum Analyzer dialog box. |
The software offers three operating modes: Normal, Average, and Max Hold. Averaging is useful in reducing signal noise so you can see more carrier or harmonic detail. Max Hold helps with swept frequency measurements and in finding rare spurs.
 |
| Figure 3: Shown at top right is the Spectrogram display; shown at top left and in the spectrum analyzer display is a number of selected peaks. |
An important option is selection of weighting windows for the FFT. The software provides choices of Von Hann (Hanning), Hamming, Flat Top, and Blackman Harris.
The Peaks/Markers tab in the Spectrum Analyzer dialog box allows finding and labeling of up to 100 peaks and the setting of up to 20 markers. Peak detection is automatic; a table of peaks can be displayed (Figure 3).
Finally, the Spectrogram display shows a history of spectral changes in a separate display grid. Up to 256 spectra are shown in vertically stacked fashion (Figure 3, again).
What's clear is that the addition of Spectrum Analyzer software to an instrument such as the HDO results in an easy-to-use interface that makes spectrum analysis a quick task.
1 comment:
Good post
Post a Comment