 |
| Figure 1: Using WaveScan to search for rare glitch events |
In many Teledyne LeCroy oscilloscopes, a front-panel push button brings up the WaveScan advanced search and analysis tool, which provides the ability to locate unusual events in a single waveform capture. It also "scans" for an event in many acquisitions over long periods of time. You can select from more than 20 search modes involving parameters such as frequency, rise time, runts, non-monotonic edges, duty cycle, serial- or parallel-data patterns, and so on. After applying a search condition, the tool begins scanning the waveform for events that meet the condition. Filter functions include rarest events, min/max parameter occurrences, within or outside limits, and Δ%.
 |
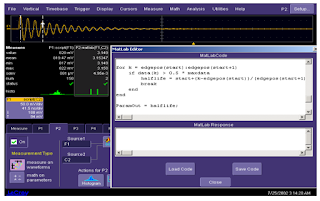
| Figure 2: The XDEV advanced customization tool allows creation of custom measurement algorithms |
looking for, WaveScan reports its results in a table that is interactively linked to the zoom trace. In this case, we've captured a lot of data: 1 s worth spread over 10M data points. We set WaveScan to find the 10 rarest events with respect to pulse width.
In addition to setting up WaveScan to search on a specified condition, you also have options with respect to what happens when it finds that condition in the waveform. These include stopping the scan (in effect, a software trigger), saving the data in a LabNotebook, or saving a screen capture.
Another helpful tool is XDEV advanced customization, which allows you to create a custom measurement algorithm. XDEV supports Matlab, C/C++, Visual Basic, VBA, Excel, and
 |
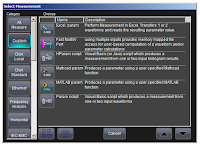
| Figure 3: Custom measurements are easily accessible in the Select Measurement dialog box |
In the example shown in Figure 2, we're using a Matlab editor to make changes to a measurement script; the result appears in the parameter table. XDEV also supports user-defined graphical user interfaces. If there are measurements you'd make often, or if you want specific users to make custom measurements, an XDEV-defined GUI would appear beneath the waveform descriptor boxes.
XDEV is easily accessible through the Select Measurement dialog box. In that dialog, select the Custom category, and then select the type of editor you prefer to use.
Next, we'll show you how to take advantage of the Sequence and History modes.
Previous posts in this series:
Getting The Most Out Of Your Oscilloscope: Setup
Getting The Most Out Of Your Oscilloscope: Navigation with MAUI
Getting The Most Out Of Your Oscilloscope: Trigger Delay
Getting The Most Out Of Your Oscilloscope: Documentation
Getting The Most Out Of Your Oscilloscope: Cursors and Parameters
Getting The Most Out Of Your Oscilloscope: Tracks and Trends
No comments:
Post a Comment