 |
| Figure 1: This screen capture depicts frequency demodulation and subsequent Manchester decoding of the bit stream |
Figure 1 depicts an example of how an oscilloscope can frequency-demodulate an RF burst and then Manchester-decode the underlying bit stream. In this case, the application is a vehicular key fob; typically, RF signals from key fobs are ASK- or FSK-modulated. Analysis requires only a few simple steps: The user selects the modulation type, enters the carrier frequency, and launches the Manchester decoder.
 |
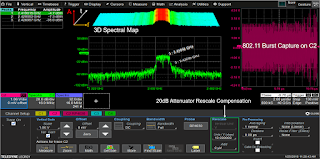
| Figure 2: Examining an 802.11 RF burst in the frequency domain details significant frequency peaks |
 |
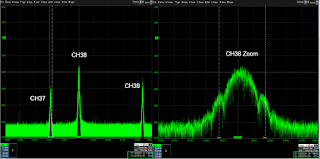
| Figure 3: A fast-Fourier transform of BLE advertising bursts shows that the signal complies with the 2-MHz bandwidth stipulation in the BLE specification |
In another illustration of spectrum analysis, Figure 3 shows an FFT of the spectral content of BLE advertising bursts. The full acquisition is at left; on the right is a zoom trace of Channel 38. The spectrum analysis shows that most of the signal's energy is contained within a 2-MHz window as the BLE specification stipulates.
 |
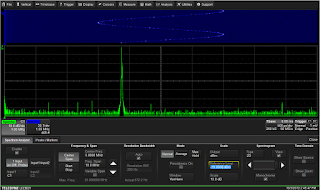
| Figure 4: The setup dialog for the oscilloscope's spectrum- analysis application looks much the same as those found on dedicated spectrum analyzers |
Orthogonal frequency-division multiplexing (OFDM) packets can be extensively analyzed using the oscilloscope's vector signal analysis application. This tool offers comprehensive OFDM analysis and visualization capabilities (Figure 5).
 |
| Figure 5: The vector signal analysis tool provides comprehensive analysis of OFDM packets |
The pilot error-vector magnitude (EVM), data EVM, and average EVM can be plotted by subcarrier and by symbol. The tool also can report measurement EVM percentage values as well as magnitude error and pilot signals.
The tool supports the 802.11a protocol, but other user-defined protocols can be tested by loading a metadata file. Figure 5 also shows the ability to render constellation diagrams, which provide visualization of the phase angle and amplitude of the resulting modulated signal. The VSA software contains a full list of selectable measurement parameters, including such items as Q factor, data and pilot EVM, SNR, and phase error. It allows for analysis of up to eight data streams in parallel. User-defined Matlab blocks can be inserted at any point in the processing chain for complete customization of the DSP process.
In upcoming posts, we'll turn our attention to the acquisition and characterization of sensor signals.
Previous blogs in this series:
Debugging the IoT
Anatomy of an IoT Device
IoT Digital Power Management and Power Integrity
Investigating IoT Wireless Signals
No comments:
Post a Comment