 |
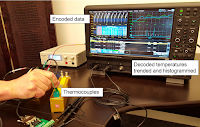
Figure 1: Temperature data from
thermocouples is shown both
encoded and decoded on the
oscilloscope's display |
A myriad of serial-data standards come into play when we're discussing Internet of Things (IoT) devices. We've talked about I2C, SPI, and UART in a
previous post. Yet another serial-bus standard that comes under the IoT umbrella is the Controller Area Network (or CANbus) standard. CANbus enables microcontrollers and peripheral devices to communicate with each other in applications without an intervening host computer. In the past, it's been typically used in automotive applications, but CANbus has found its way into a wider scope of applications of late.
 |
Figure 2: A closer look at the
oscilloscope display from
Figure 1 shows encoded and
decoded temperature data |
Figure 1 provides a real-world example of what CANbus debugging looks like in practice. The image shows thermocouple signals being transmitted over CANbus. The left side of the oscilloscope's screen shows encoded bus traffic, with the temperature data from the sensors encoded in binary. On the right side of the display, the temperatures are shown decoded and broken out in histogram format.
 |
Figure 3: CANbus traffic from an
accelerometer can be decoded and
trend-plotted on an oscilloscope
to observe changes over time |
A closer look at the display appears in Figure 2. The grid at lower right shows a trend plot of the temperature data as it varies over time. There are two thermocouples being tracked, with the blue track rising and the green falling. The histogram shows the distribution of the temperature data, all of which originates from encoded CANbus traffic.
 |
Figure 4: Another closeup of the
oscilloscope display shows the
trend plot of accelerometer data |
Similarly, the oscilloscope can be used to trend-plot data from motion sensors. In Figure 3, we see an engineer holding an accelerometer. As the device is shaken, the device outputs encoded digital data representing its X, Y, and Z coordinates. The oscilloscope extracts these values from the decoded data and displays a trend plot of the changes in the coordinates over time.
As with the thermocouple data, a better look at the oscilloscope's display shows the X, Y, and Z position data encoded as blue, orange, and green trend plots (Figure 4). It's not unlike a datalogger that shows the rapid changes in position in great detail.
Coming next is a post about Ethernet, SATA, and PCIe debug for IoT devices.
Previous blogs in this series:
Debugging the IoT
Anatomy of an IoT Device
IoT Digital Power Management and Power Integrity
Investigating IoT Wireless Signals
Investigating IoT Wireless Signals (Part II)
Acquiring and Characterizing IoT Sensor Signals
Debugging Low-Speed Serial Data on IoT Devices


No comments:
Post a Comment