 |
| Figure 1: A representative block diagram of a mixed-signal embedded system |
You need to test, we're here to help.
You need to test, we're here to help.
16 April 2014
Is Your Testbench Mixed-Signal Ready?
09 April 2014
Applying Multi-Stage, Multi-Rate Digital Filtering
 |
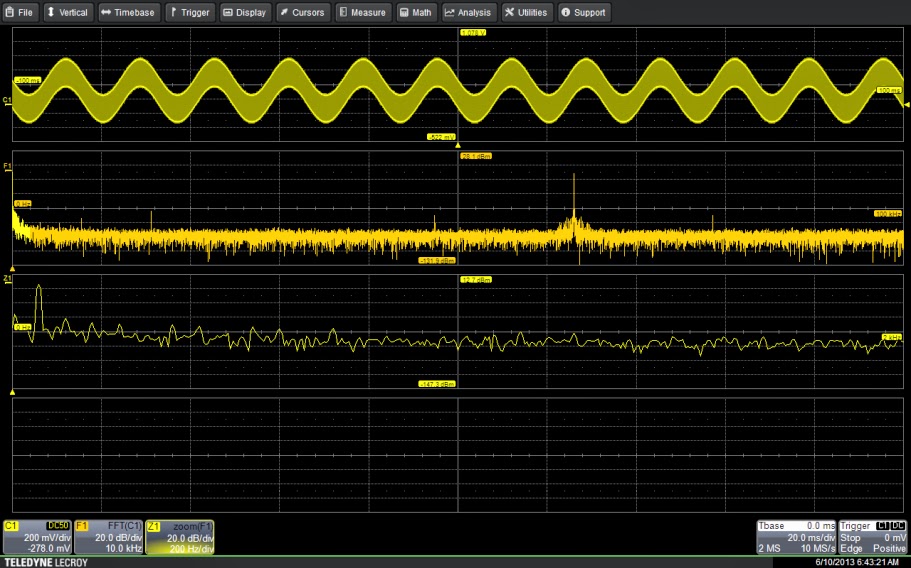
| Figure 1: The input signal shows both the desired 63-kHz signal along with a 60-Hz component. Zoom trace Z1 shows the 60-Hz component in detail. |
02 April 2014
Understanding Probe Calibration Methods (Part II)
 |
| Figure 1: Experimental setup for comparing a source-referred signal to an unloaded signal |
Subscribe to:
Comments (Atom)